Fig. 12.
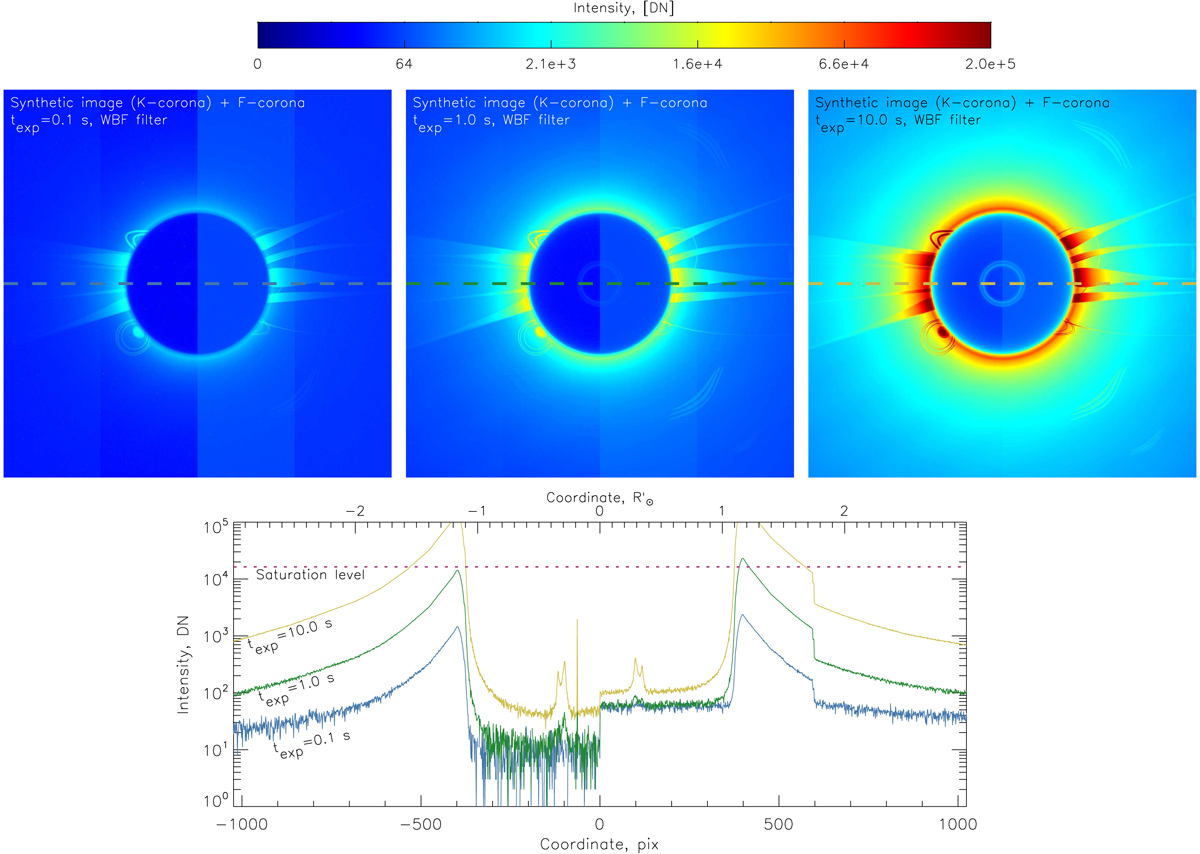
Examples of ASPIICS simulated data, generated with the described algorithm. The three panels show simulated data generated with a synthetic K and F corona and all the other known effects, for the WBF filter. The exposure times are 0.1 s (left), 1.0 s (middle), and 10.0 s (right). The bottom panel shows horizontal profiles taken through the center of the images. The color of the lines corresponds to the dashed lines in the images. The saturation level is given, but the signal in the simulated images is not clipped.
Current usage metrics show cumulative count of Article Views (full-text article views including HTML views, PDF and ePub downloads, according to the available data) and Abstracts Views on Vision4Press platform.
Data correspond to usage on the plateform after 2015. The current usage metrics is available 48-96 hours after online publication and is updated daily on week days.
Initial download of the metrics may take a while.