Fig. 11.
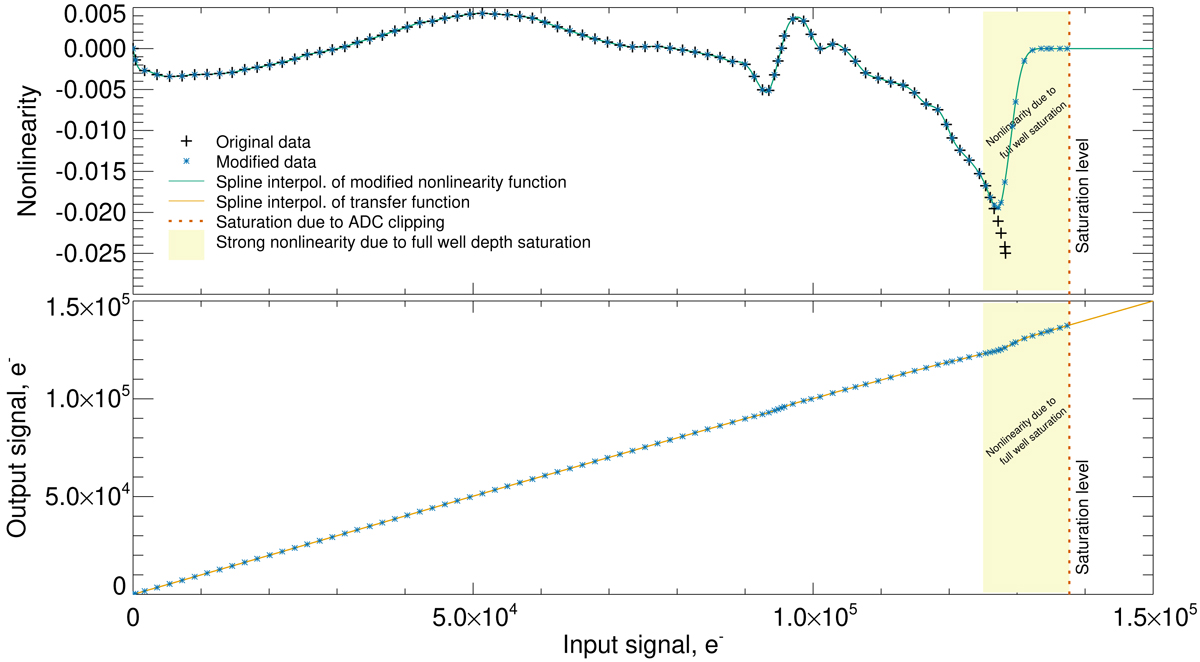
Adopted detector nonlinearity. Top panel: nonlinearity function, defined as the ratio of the measured response to a linear response minus one. Bottom panel: nonlinear transfer function ℒ(). Pluses denote originally measured data, asterisks denote modified data, and solid lines denote spline interpolation. The vertical dotted lines denote the clipping by ADC at 214 [DN], and the filled area denotes the strong nonlinearity due to the full well depth (see details in the text).
Current usage metrics show cumulative count of Article Views (full-text article views including HTML views, PDF and ePub downloads, according to the available data) and Abstracts Views on Vision4Press platform.
Data correspond to usage on the plateform after 2015. The current usage metrics is available 48-96 hours after online publication and is updated daily on week days.
Initial download of the metrics may take a while.