Free Access
Fig. 10.
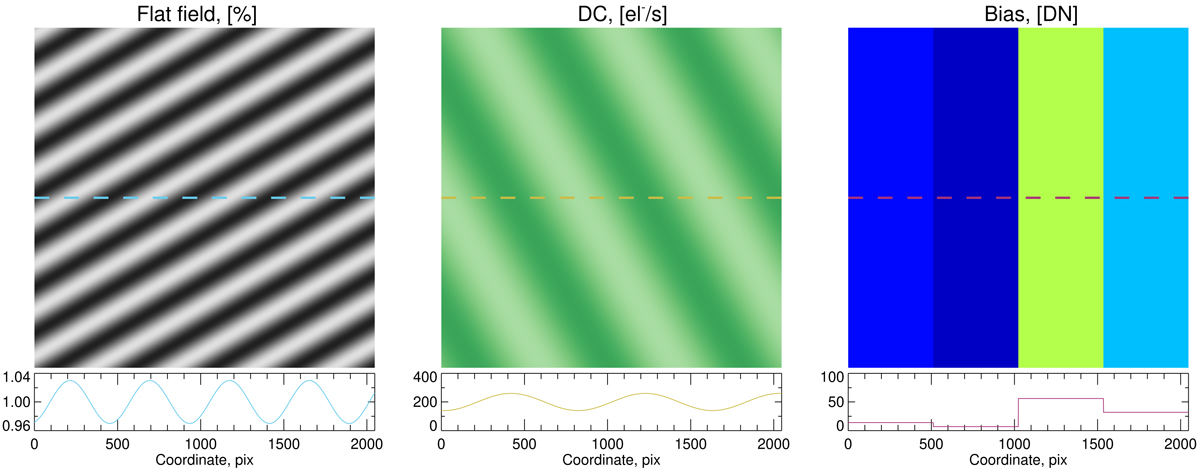
Adopted 2D maps of the flat field (left panel), dark current (middle panel), and bias (right panel). Below each panel we show a horizontal profile through the center of the image. The y-axis units of each panel are designated at the top of the images.
Current usage metrics show cumulative count of Article Views (full-text article views including HTML views, PDF and ePub downloads, according to the available data) and Abstracts Views on Vision4Press platform.
Data correspond to usage on the plateform after 2015. The current usage metrics is available 48-96 hours after online publication and is updated daily on week days.
Initial download of the metrics may take a while.