Fig. F.1.
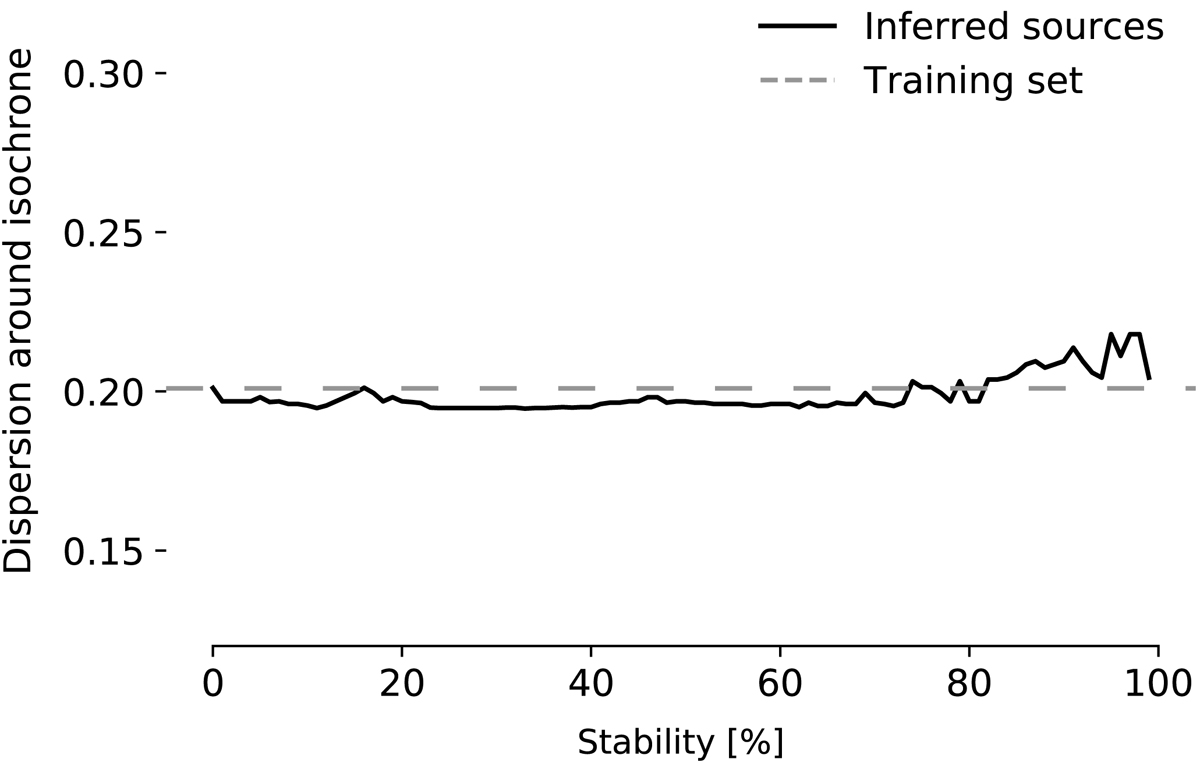
Comparison between the training and predicted (inferred) sources across the full stability range. The y-axis shows the standard deviation of residuals between the data and an isochrone of 5 Myr, describing the best fit to the training data. We find no significant difference between the training set members and the predicted sources based on their HRD distributions.
Current usage metrics show cumulative count of Article Views (full-text article views including HTML views, PDF and ePub downloads, according to the available data) and Abstracts Views on Vision4Press platform.
Data correspond to usage on the plateform after 2015. The current usage metrics is available 48-96 hours after online publication and is updated daily on week days.
Initial download of the metrics may take a while.