Fig. D.1.
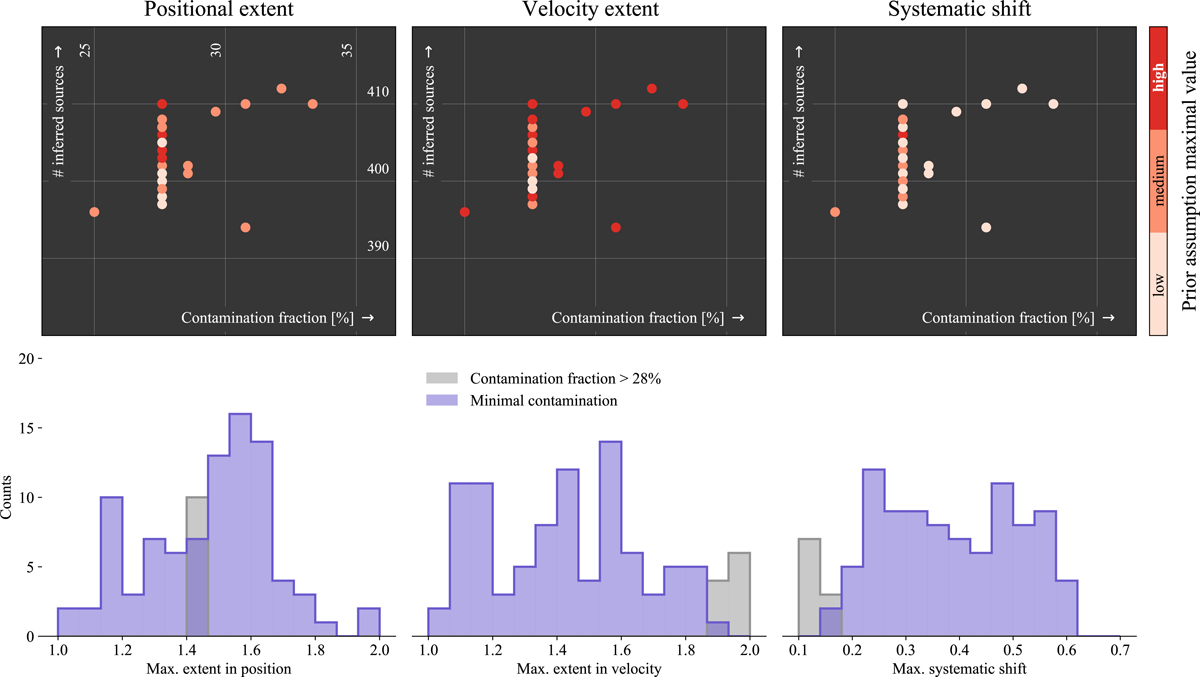
Distribution of the number of predicted sources and contamination fraction space of these ensemble classifiers. Top: distribution of 100 ensemble classifiers trained using various prior assumption constraints in the number of predicted sources and contamination fraction space. We have randomly sampled the prior assumption of the maximal positional extent (left column), the maximal velocity extent (middle column) and the maximal systematic shift (right column) within their respective ranges. The color highlights the maximal prior assumption value. Bottom: sampled prior assumption distributions for models showing a contamination of less than 0.28 (in purple) and remaining models (in gray). For models with a higher contamination fraction we observe a tendency to higher velocity dispersion and a small systematic shift.
Current usage metrics show cumulative count of Article Views (full-text article views including HTML views, PDF and ePub downloads, according to the available data) and Abstracts Views on Vision4Press platform.
Data correspond to usage on the plateform after 2015. The current usage metrics is available 48-96 hours after online publication and is updated daily on week days.
Initial download of the metrics may take a while.