Fig. 10.
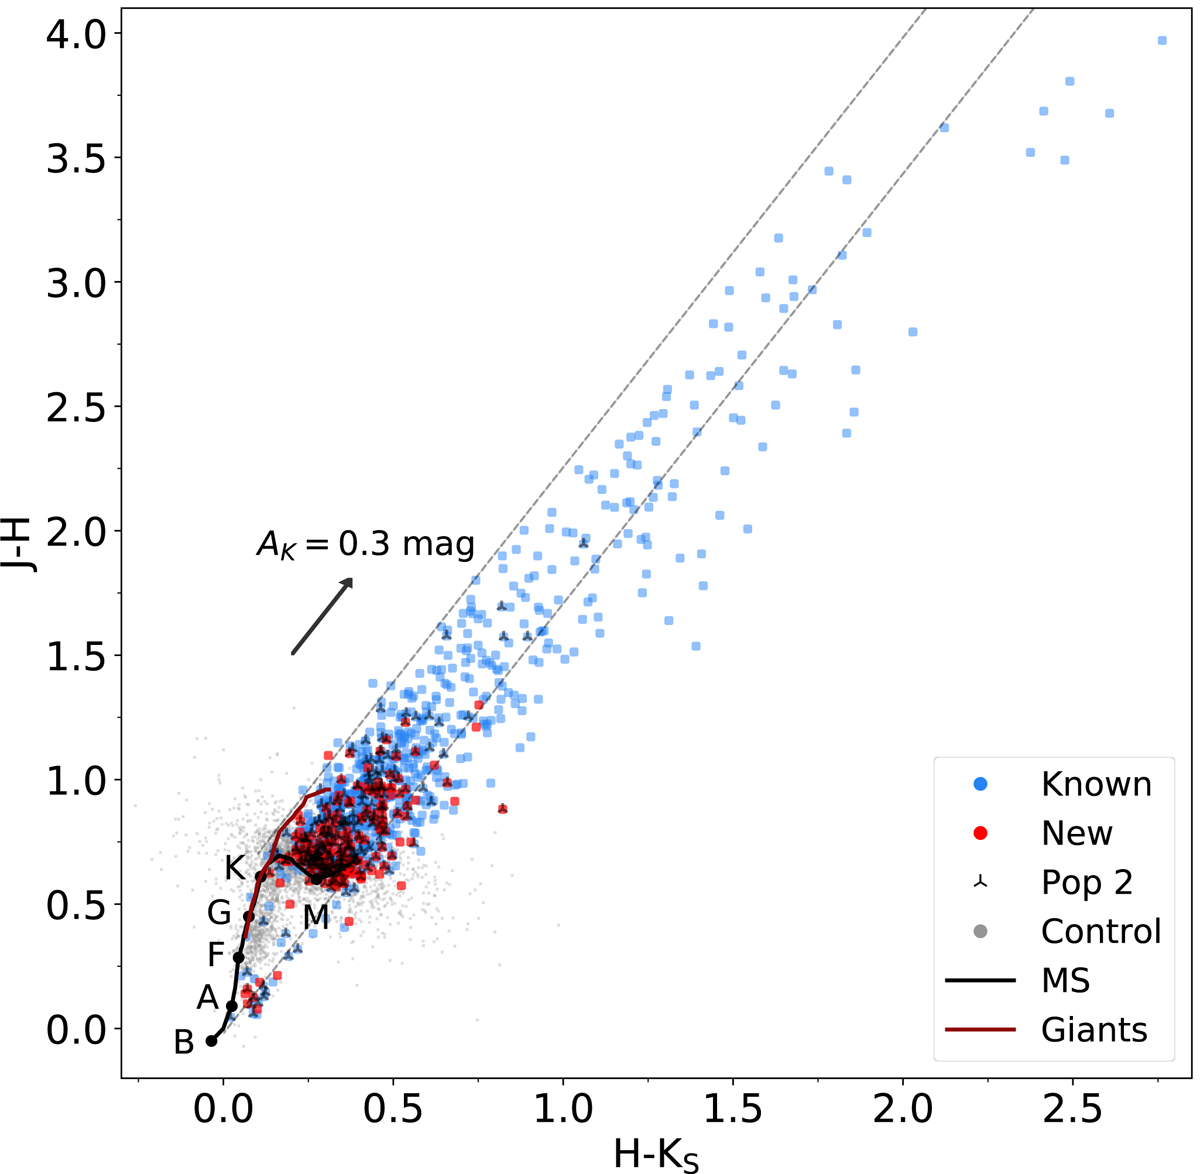
Near-infrared color–color diagram of the know (blue) and new (red) ρ Oph sources, including the control sample in gray and the sources from the second population (Pop 2) as black symbols, using the J, H and KS passbands from 2MASS. The main sequence and the giant branches from Bessell & Brett (1988) are included in the diagram, as well as an extinction vector in the KS passband, labeled as AK. The two parallel lines with the slope of the extinction vector enclose sources that are reddened mainly due to extinction in this color space.
Current usage metrics show cumulative count of Article Views (full-text article views including HTML views, PDF and ePub downloads, according to the available data) and Abstracts Views on Vision4Press platform.
Data correspond to usage on the plateform after 2015. The current usage metrics is available 48-96 hours after online publication and is updated daily on week days.
Initial download of the metrics may take a while.