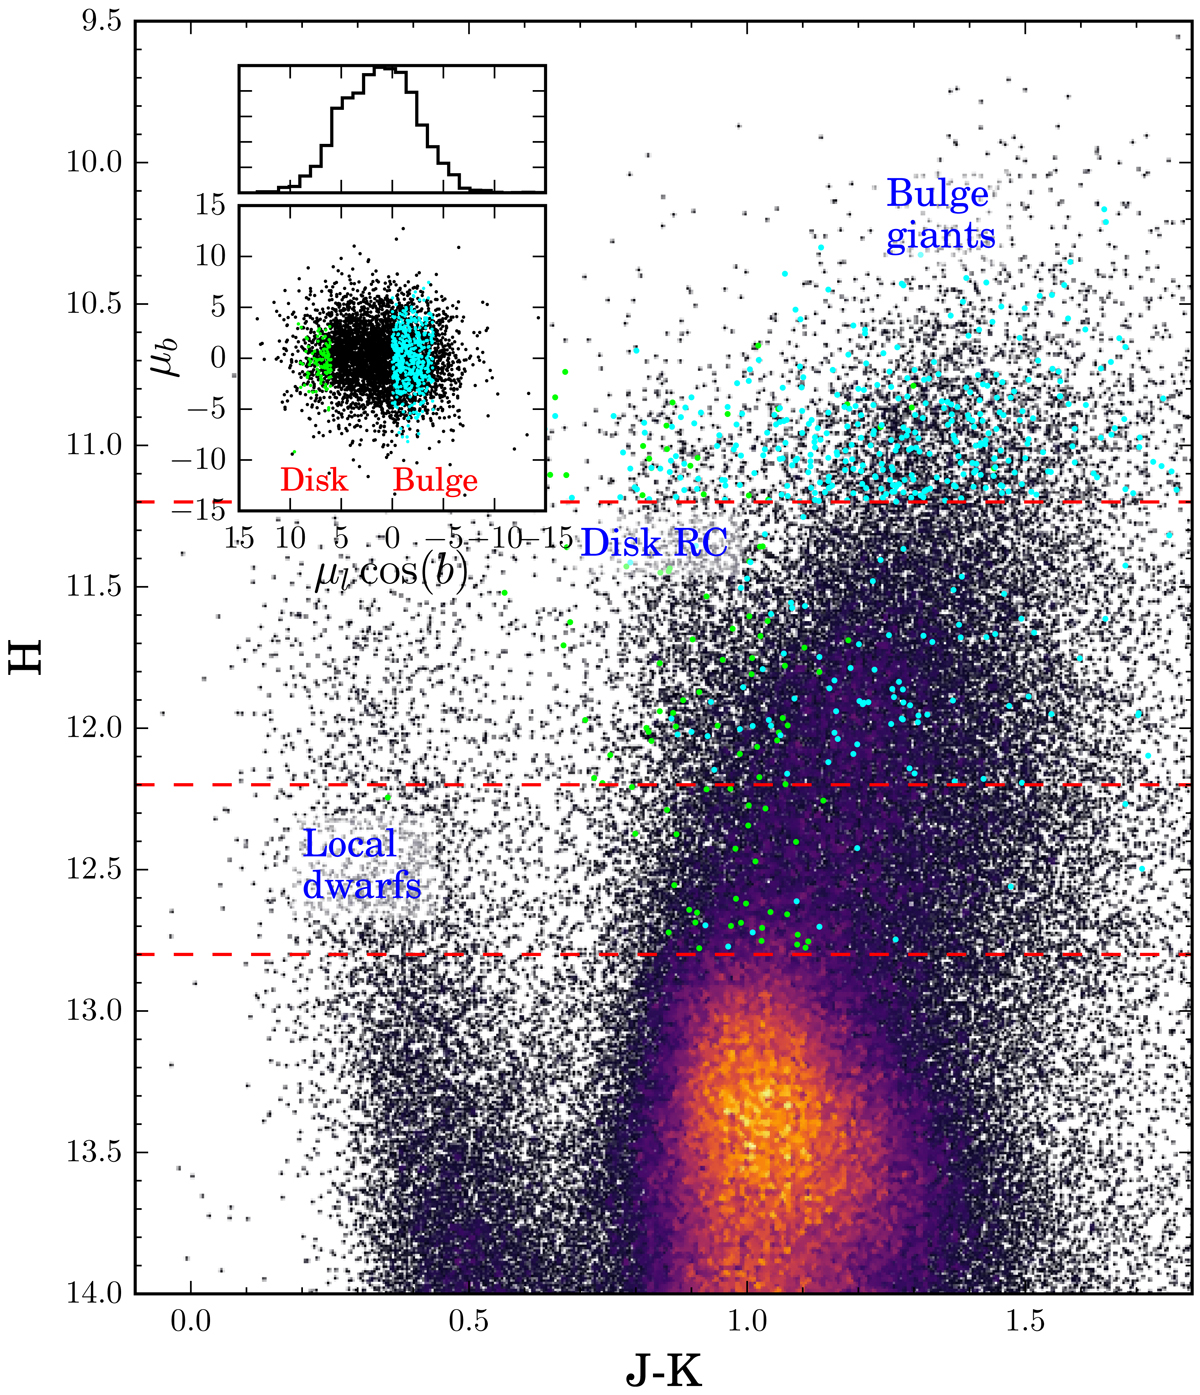
Fig. 2.

Download original image
Selection function of bulge and disk field giants. Main panel: annotated CMD of a typical bulge field (003-03-C) is shown as a Hess diagram. The horizontal red dashed lines indicate the magnitude limits adopted to select cohorts, as described in the main text. Inset panel: μlcos(b) vs. μb VVV PM diagram. The black points correspond to a random 2500 field star subsample with small errors in PMs. The cyan (green) points in both panels display the kinematically selected bulge (disk) giants from the magnitude ranges displayed in the main panel.
Current usage metrics show cumulative count of Article Views (full-text article views including HTML views, PDF and ePub downloads, according to the available data) and Abstracts Views on Vision4Press platform.
Data correspond to usage on the plateform after 2015. The current usage metrics is available 48-96 hours after online publication and is updated daily on week days.
Initial download of the metrics may take a while.


