Fig. 8.
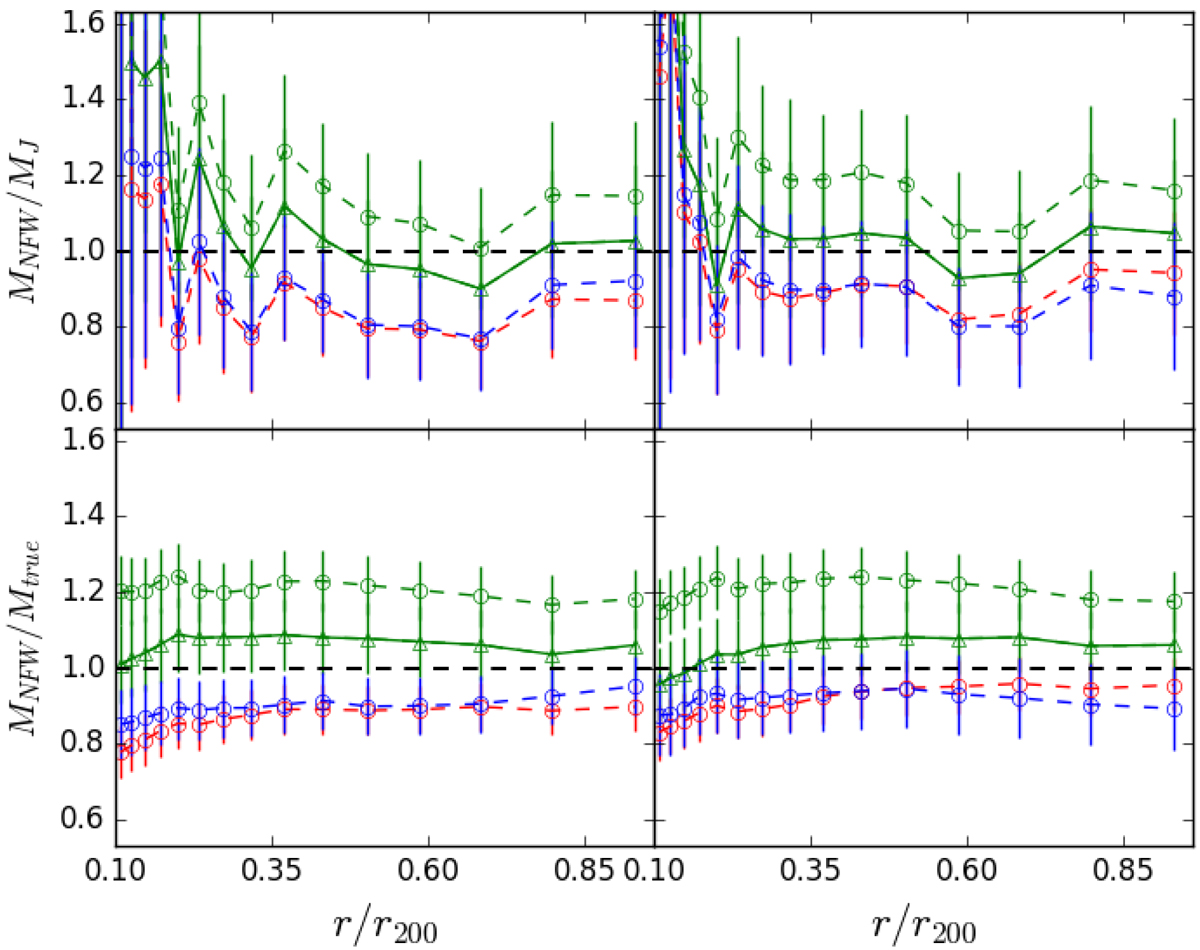
Ratio of different mass profile determinations. Top panels: ratio of the median NFW mass profile determined with MAMPOSSt, MNFW(r), based on projected phase-space information, to the mass profile determined by direct application of the Jeans equation using full phase-space information, MJeans. The red, blue and green symbols refer to the C, C100, and RM samples, respectively. The solid line represents the result for the RM sample obtained by adopting r200 as the maximum integration distance in MAMPOSSt. Bottom panels: ratio of MNFW(r) to the true mass profile, Mtrue. Left, respectively right, panels show the results obtained on the DLB07, respectively GAEA, samples.
Current usage metrics show cumulative count of Article Views (full-text article views including HTML views, PDF and ePub downloads, according to the available data) and Abstracts Views on Vision4Press platform.
Data correspond to usage on the plateform after 2015. The current usage metrics is available 48-96 hours after online publication and is updated daily on week days.
Initial download of the metrics may take a while.