Fig. 1.
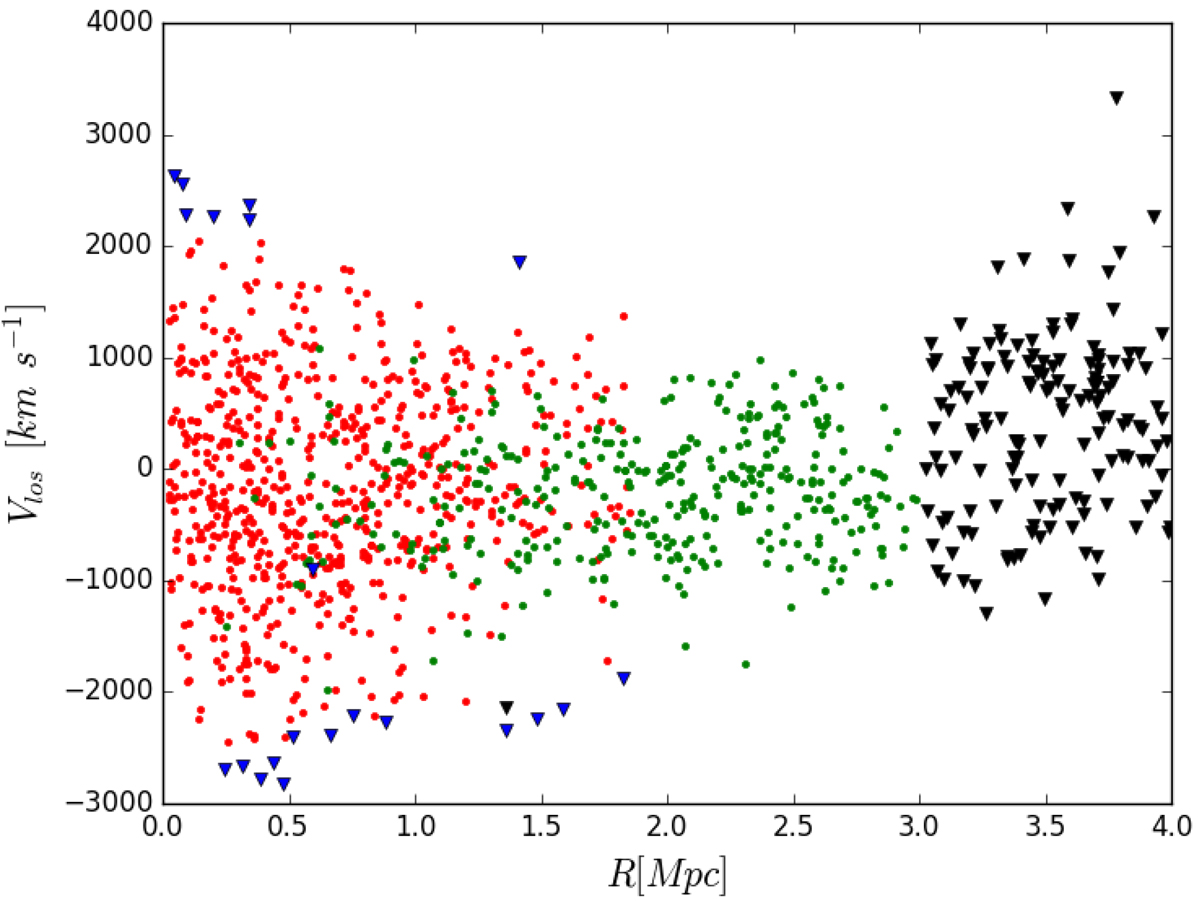
Projected phase-space diagram (line-of-sight velocities vs. cluster-centric distances) of a simulated cluster from the DLB07 sample. Dots (triangles) indicate galaxies selected (respectively, not selected) by CLEAN as cluster members. The red dots represent real members, located within the r200 sphere, while green dots represent interlopers, galaxies identified as members but outside the r200 sphere. The blue triangles stand for real members (within the r200 sphere) incorrectly rejected as interlopers by CLEAN, while black triangles indicate galaxies beyond the 3 Mpc limiting distance of our projected-phase space dynamical analysis.
Current usage metrics show cumulative count of Article Views (full-text article views including HTML views, PDF and ePub downloads, according to the available data) and Abstracts Views on Vision4Press platform.
Data correspond to usage on the plateform after 2015. The current usage metrics is available 48-96 hours after online publication and is updated daily on week days.
Initial download of the metrics may take a while.