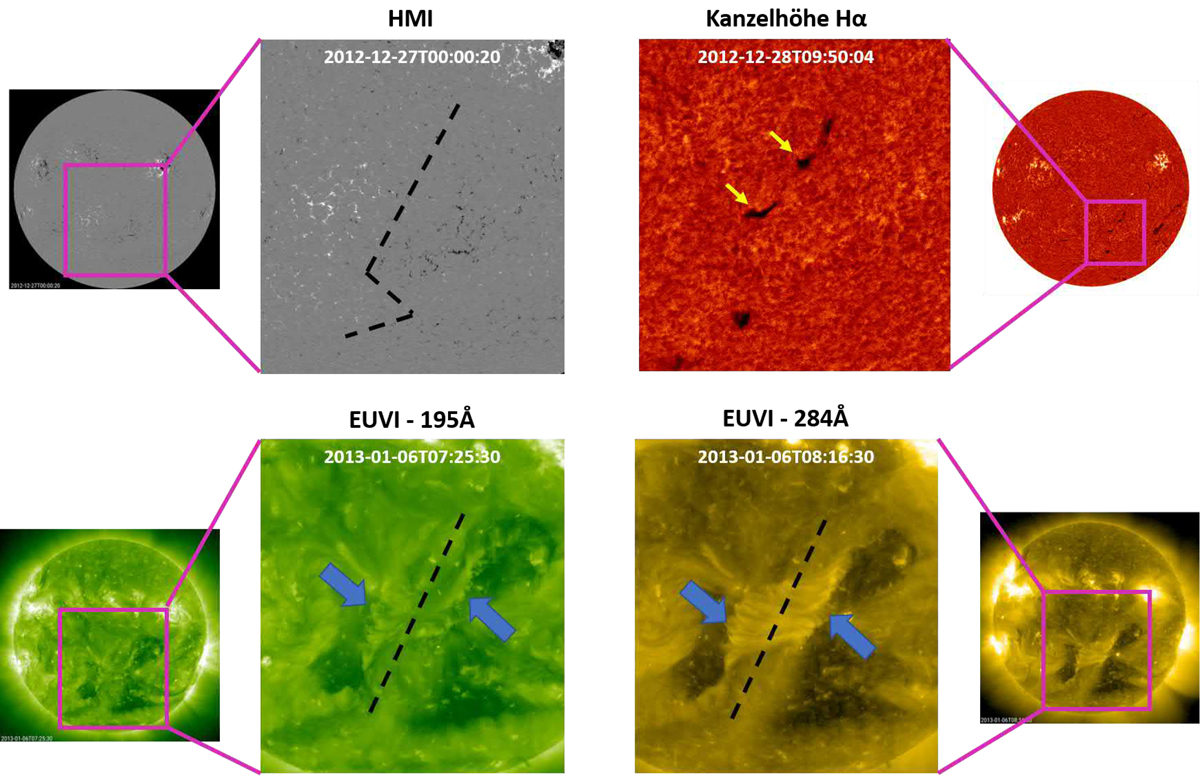
Fig. 6.

Filament and post-eruption characteristics used in identifying the flux rope helicity sign. The date format in these images is yyyy-mm-ddThh:mm:ss. The magenta squares show the area of the Sun that is being magnified. The images in the top left corner show the magnetic field topology captured by the HMI magnetogram a few days prior to the eruption. The black line marks the PIL. In the top right corner there are Hα images of the Sun taken with the solar telescope at Kanzelhöhe Solar Observatory and compensated for limb-darkening following the method by Chatzistergos et al. (2018). Barb structures are indicated with yellow arrows. The STEREO-A EUVI filtergrams at 195 Å and 284 Å correspond to the left and right images in the bottom row, respectively, and they show the post-eruption arcade and flare ribbons. The latter is indicated by blue arrows in the bottom row zoomed images, while the black dashed line indicates the PIL.
Current usage metrics show cumulative count of Article Views (full-text article views including HTML views, PDF and ePub downloads, according to the available data) and Abstracts Views on Vision4Press platform.
Data correspond to usage on the plateform after 2015. The current usage metrics is available 48-96 hours after online publication and is updated daily on week days.
Initial download of the metrics may take a while.


