Fig. 3.
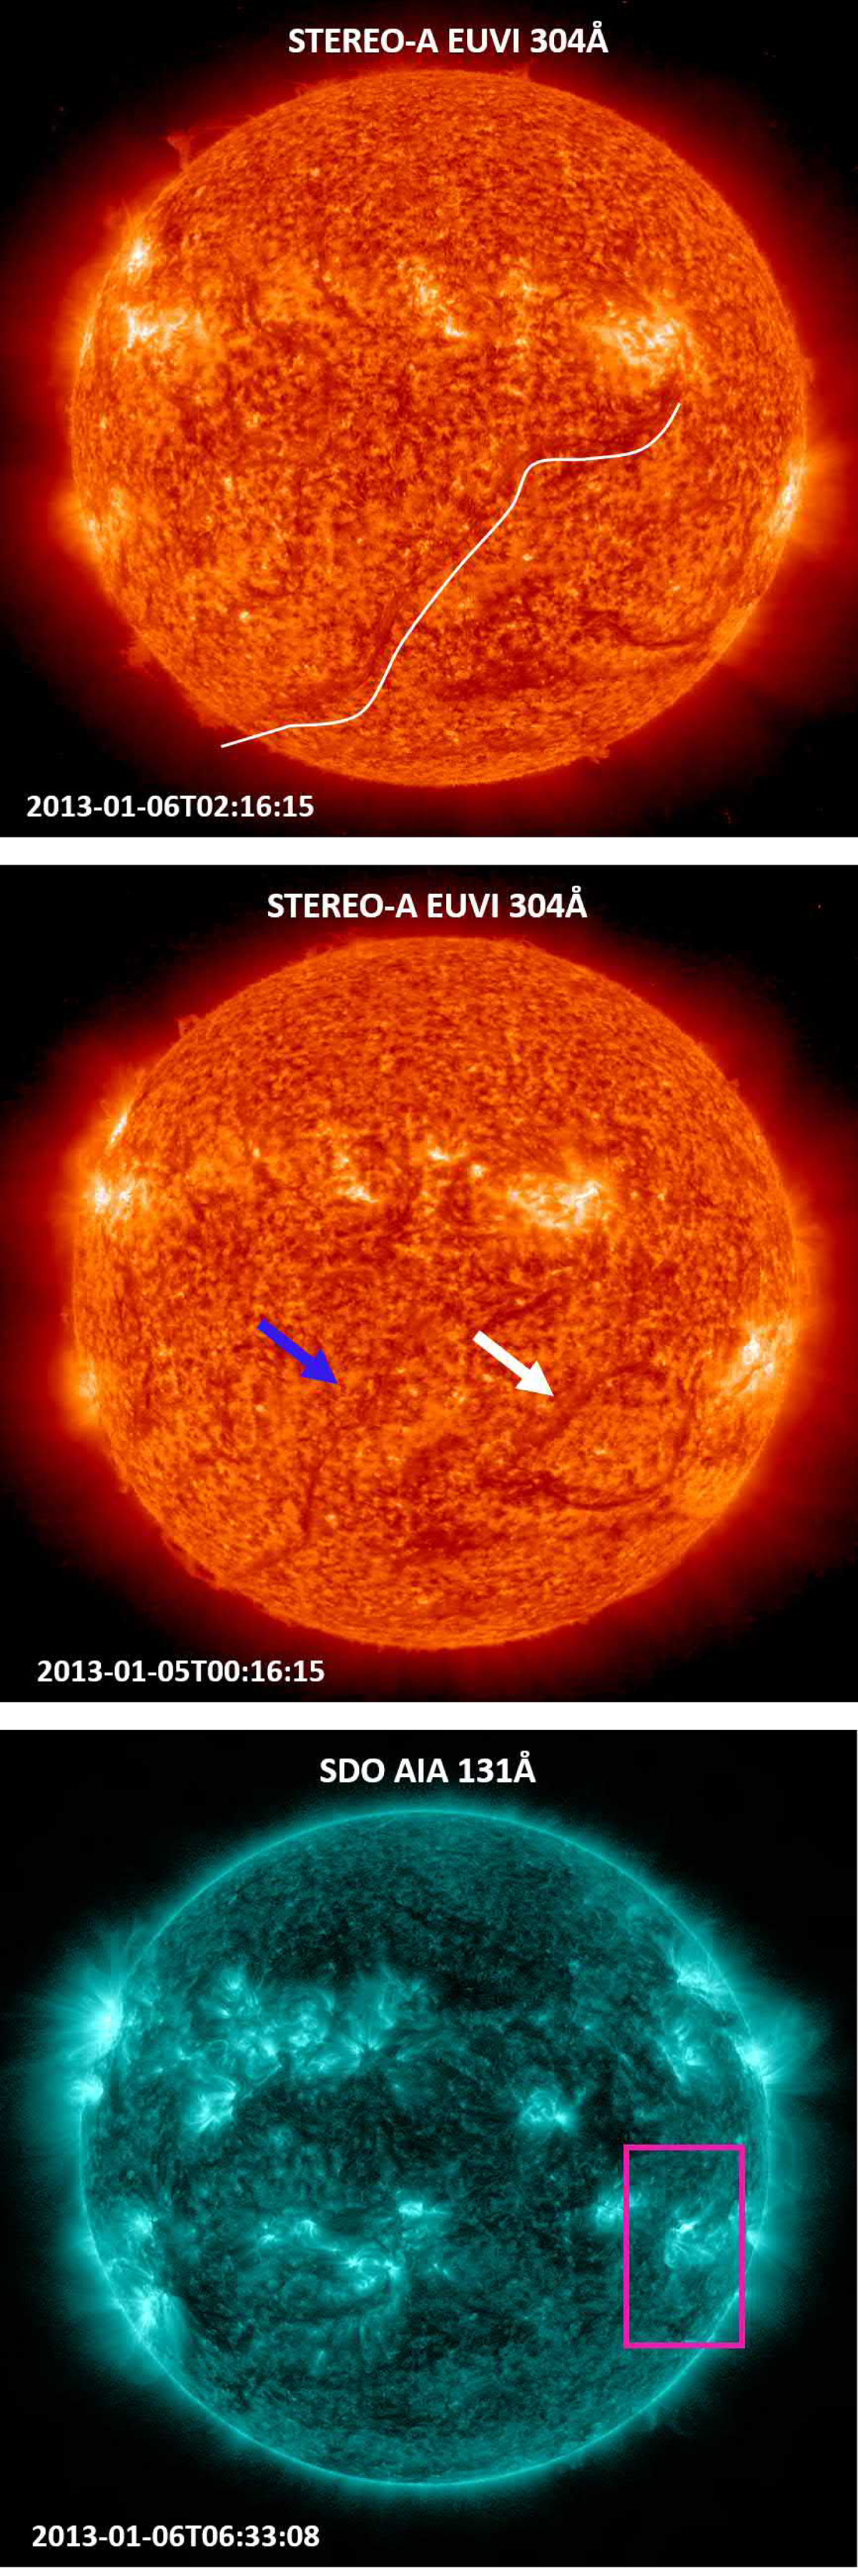
Top image: filament, indicated by a thin white (hand-drawn) line, approximately one hour before it erupted, as seen in STEREO-A EUVI filtergrams at 304 Å. The white line is placed immediately below the actual structure so that it does not cover it. As it appears the filament was a rather large structure, spanning from north equatorial latitudes to south polar latitudes, with a anticlockwise tilt with respect to the solar equatorial plane. A part of the filament possibly wrapped beyond the instrument’s field of view near the south pole. Middle image: STEREO-A EUVI filtergram at 304 Å showing both filaments that later on erupted one day apart, producing two distinct CMEs, the primary one indicated by a blue arrow and the earlier erupting one by a white arrow. Bottom image: SDO-AIA filtergrams at 131 Å with a magenta rectangle enclosing the location of the third eruption, a solar flare, that produced a CME which was visible in the STEREO-A COR2 white-light images indicated in Fig. 5 (yellow arrow).
Current usage metrics show cumulative count of Article Views (full-text article views including HTML views, PDF and ePub downloads, according to the available data) and Abstracts Views on Vision4Press platform.
Data correspond to usage on the plateform after 2015. The current usage metrics is available 48-96 hours after online publication and is updated daily on week days.
Initial download of the metrics may take a while.