Open Access
Fig. A.1.
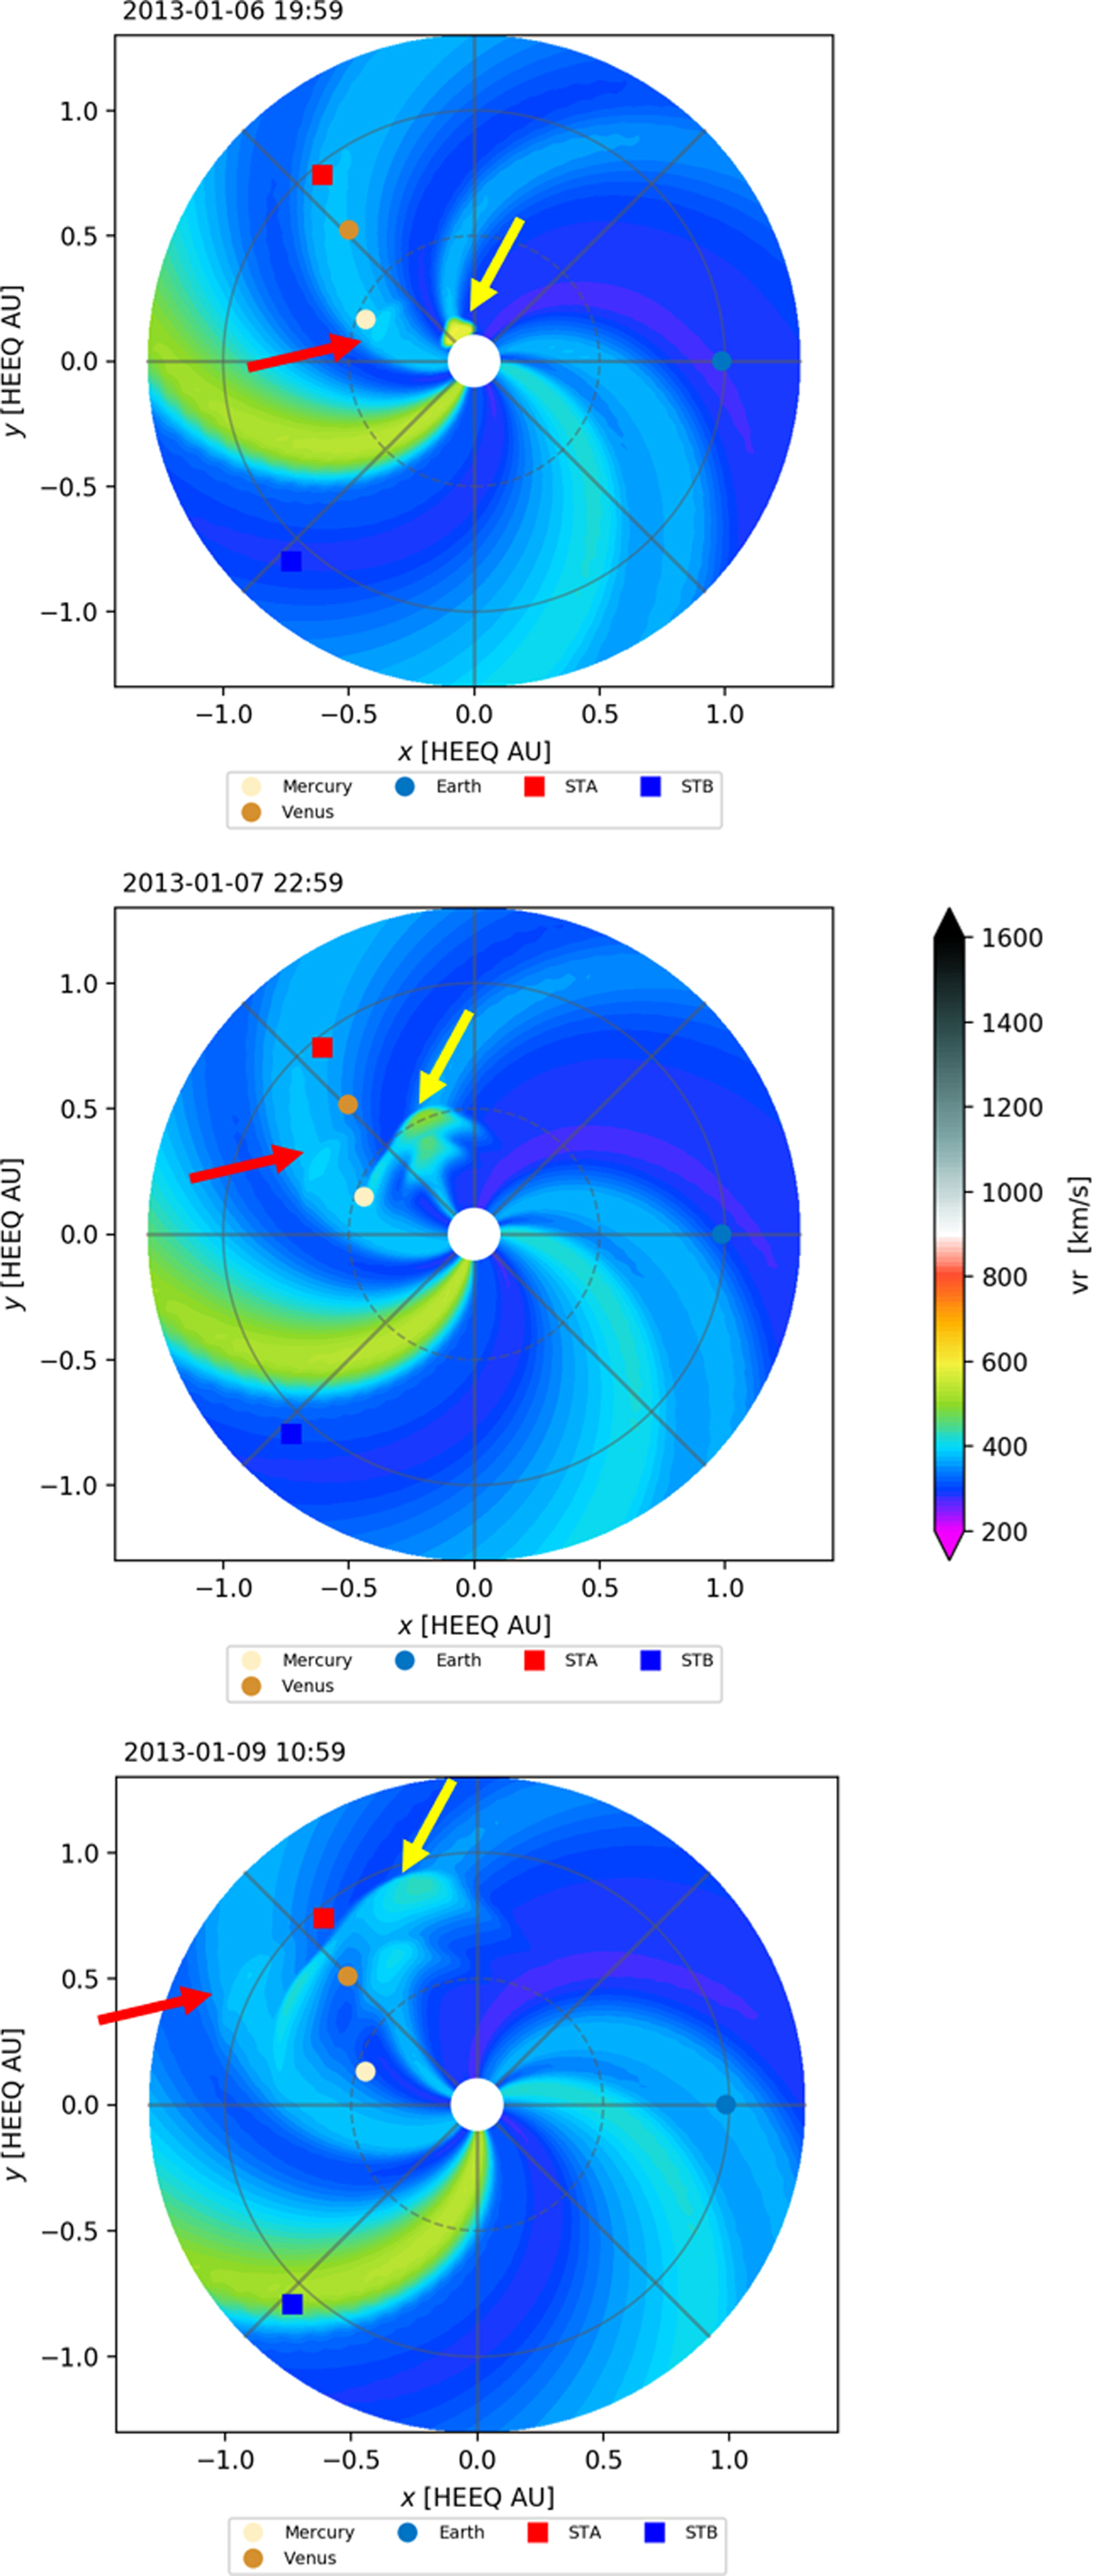
Equatorial cuts of the EUHFORIA output modelling the two filament eruptions. The red arrow in each panel indicates the modelled CME that corresponds to the filament that erupted first and the yellow arrow shows the second CME that would be generated by the filament eruption that is the primary event in this study.
Current usage metrics show cumulative count of Article Views (full-text article views including HTML views, PDF and ePub downloads, according to the available data) and Abstracts Views on Vision4Press platform.
Data correspond to usage on the plateform after 2015. The current usage metrics is available 48-96 hours after online publication and is updated daily on week days.
Initial download of the metrics may take a while.