Fig. 9.
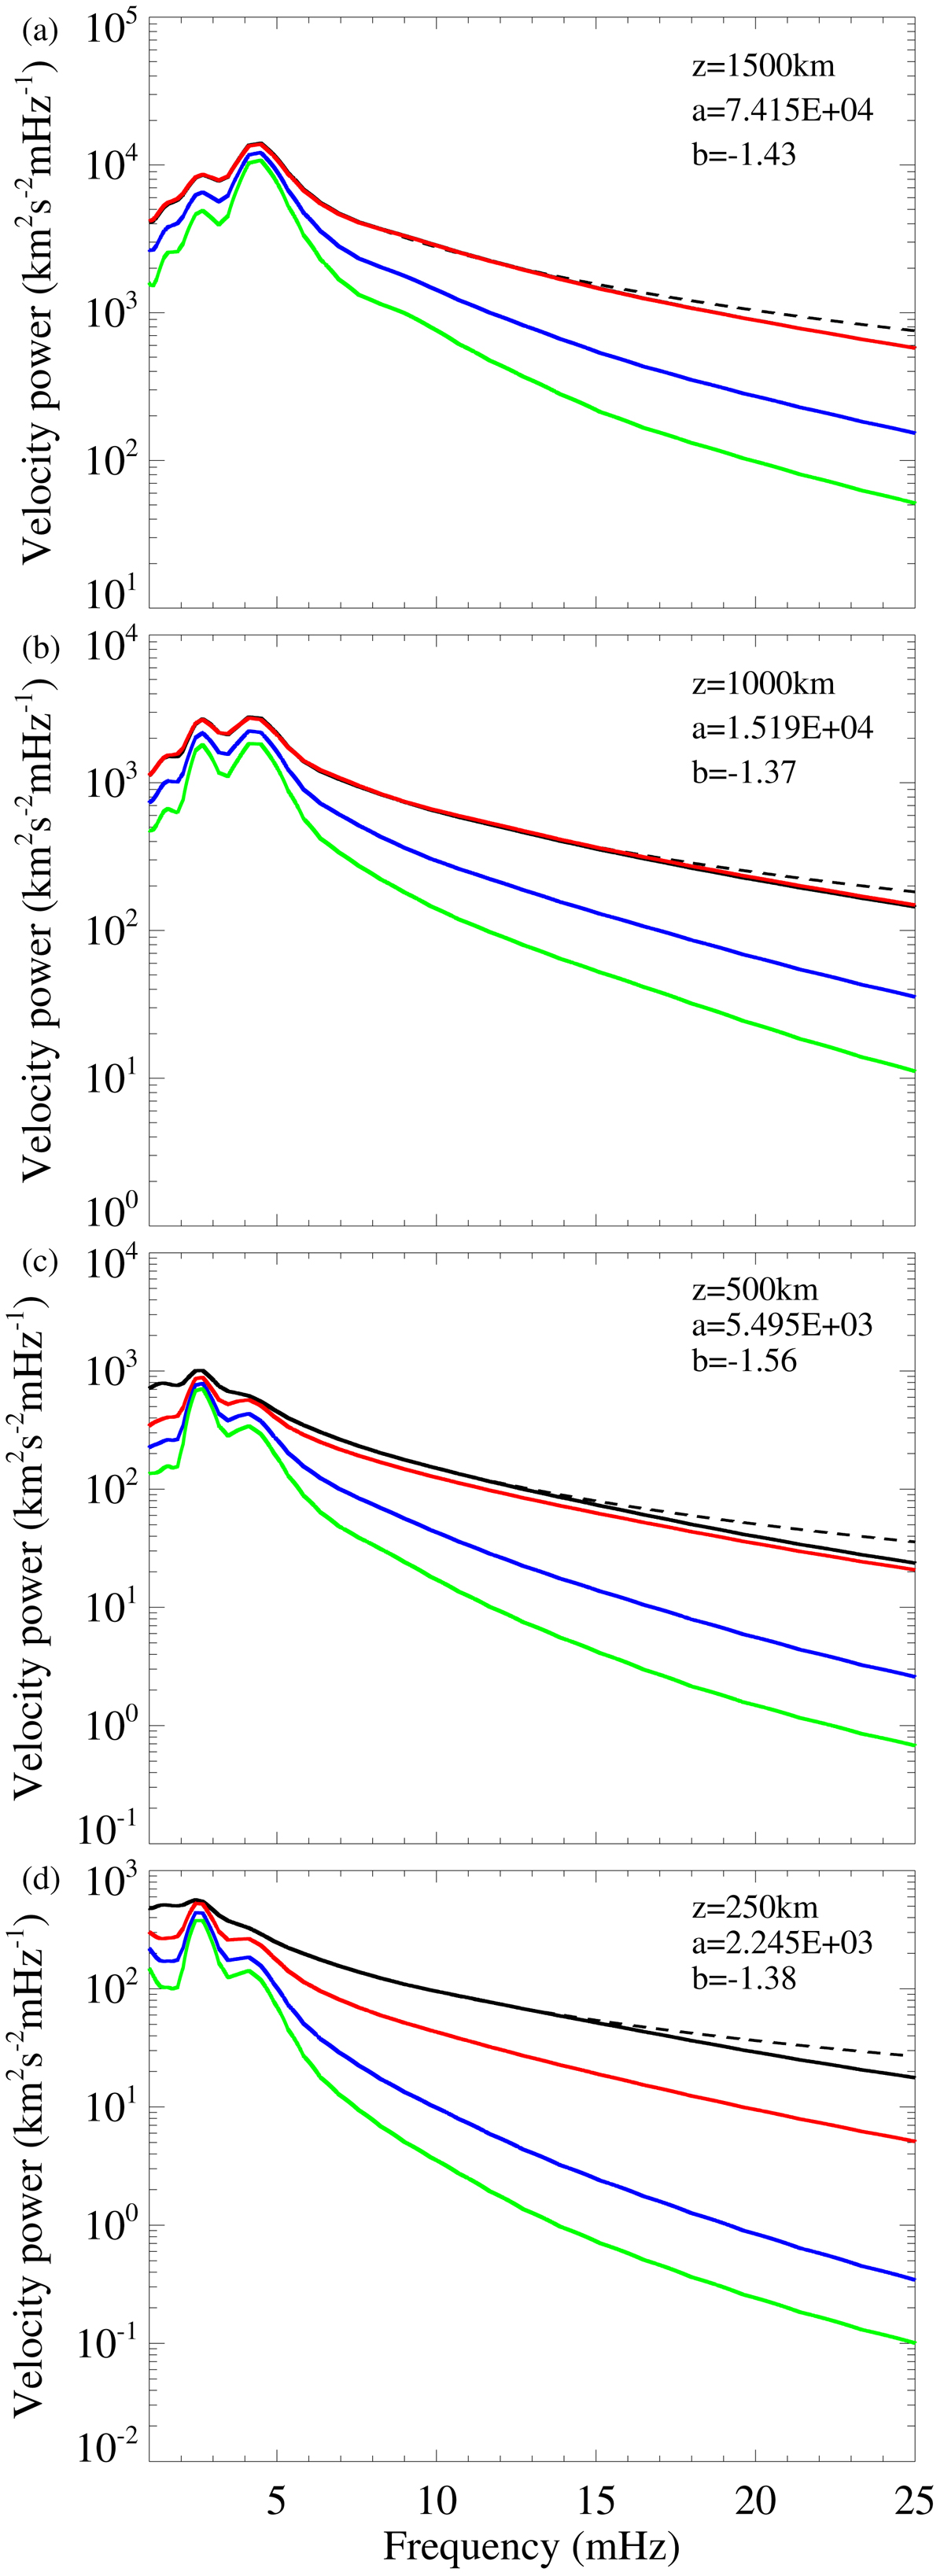
Power spectra of longitudinal velocity, i.e., velocity parallel to the field (black) and vertical velocity (red) at the full resolution of simulations. Power spectra of vertical velocity for degraded simulation data with an effective resolution of 100 km (blue) and 200 km (green). Dashed curve displays a power-law fit to the black curve in the frequency range 6–25 mHz in each panel. Different panels correspond to different heights as mentioned in each panel. Here, “a” and “b” are the amplitude and the exponent for the power law.
Current usage metrics show cumulative count of Article Views (full-text article views including HTML views, PDF and ePub downloads, according to the available data) and Abstracts Views on Vision4Press platform.
Data correspond to usage on the plateform after 2015. The current usage metrics is available 48-96 hours after online publication and is updated daily on week days.
Initial download of the metrics may take a while.