Fig. 6.
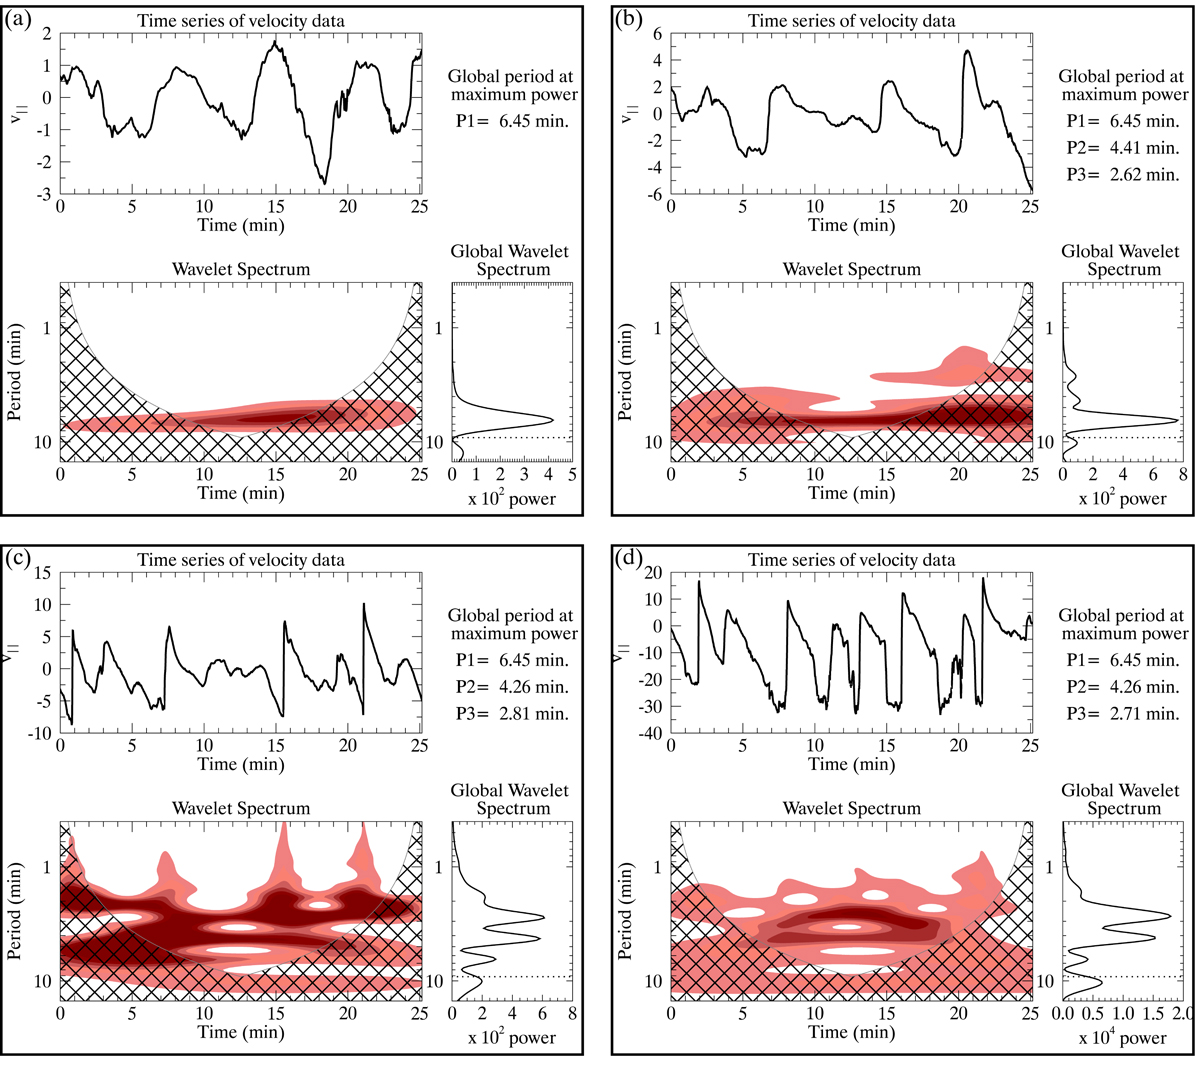
Wave trains (upper sub-panels) and wavelet spectrum of longitudinal (i.e., parallel to the magnetic field) component of the velocity at different heights viz. (a): z = 0, (b): z = 500 km, (c): z = 1000 km and (d): z = 1500 km above the mean solar surface for an example case (shown as cyan asterisk in Fig. 1) while tracking the field line in space and time (darker color corresponds to higher power). Hatched areas indicate parts of the power spectrum that are less reliable (cone of influence). In the subpanels at the right, global wavelet power spectra are plotted. The horizontal dotted line corresponds to the maximum period for which the power can be determined by the wavelet transform.
Current usage metrics show cumulative count of Article Views (full-text article views including HTML views, PDF and ePub downloads, according to the available data) and Abstracts Views on Vision4Press platform.
Data correspond to usage on the plateform after 2015. The current usage metrics is available 48-96 hours after online publication and is updated daily on week days.
Initial download of the metrics may take a while.