Fig. 5.
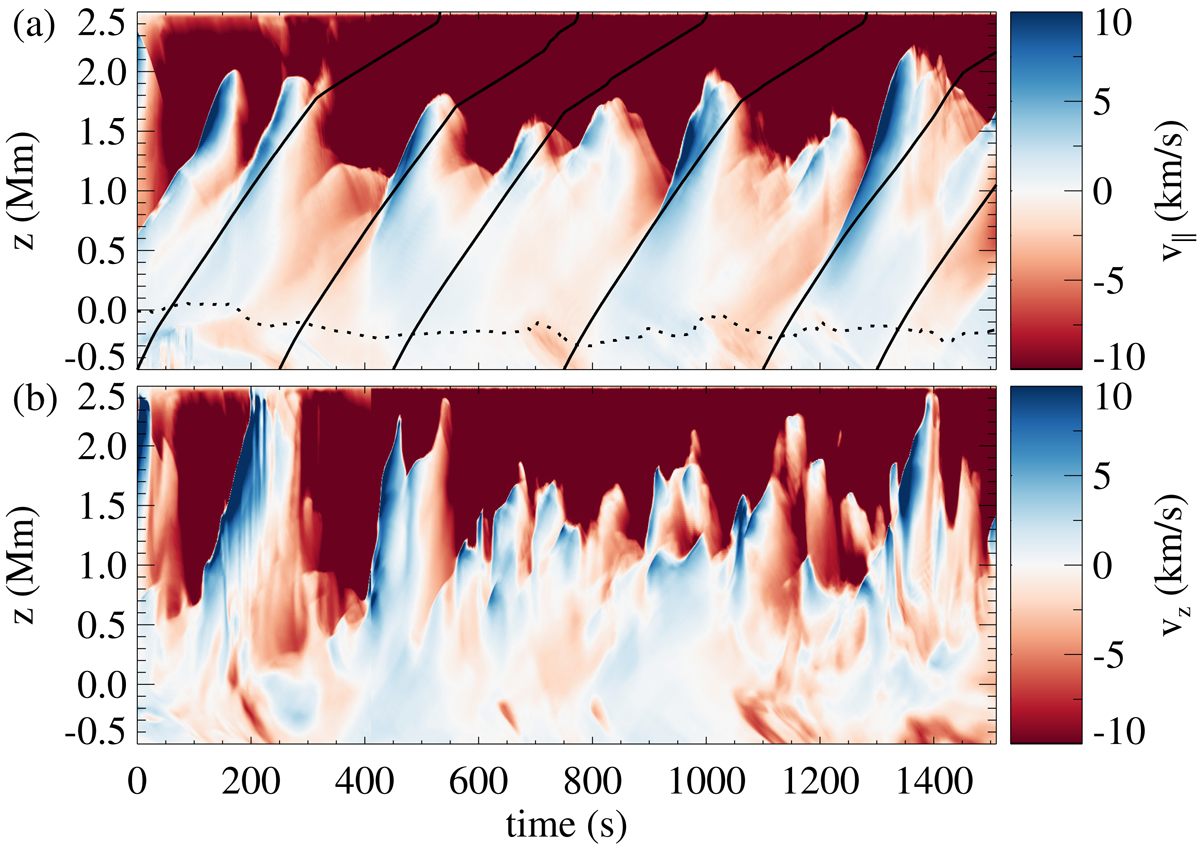
Height-time map of the longitudinal and the vertical component of velocity. (a): height-time map of the component of velocity along a magnetic field line that is tracked in time using the method described in Sect. 2.2. The field line initially passing through the seed point identified by the cyan asterisk in Fig. 1 is considered here. Local sound speed curves (solid) and a curve showing the height at which cs = vA (dotted) are also over-plotted, (b): height-time map for a fixed horizontal location i.e., initial seed location without following the magnetic field line for the seed point shown as cyan asterisk in Fig. 1.
Current usage metrics show cumulative count of Article Views (full-text article views including HTML views, PDF and ePub downloads, according to the available data) and Abstracts Views on Vision4Press platform.
Data correspond to usage on the plateform after 2015. The current usage metrics is available 48-96 hours after online publication and is updated daily on week days.
Initial download of the metrics may take a while.