Fig. 3.
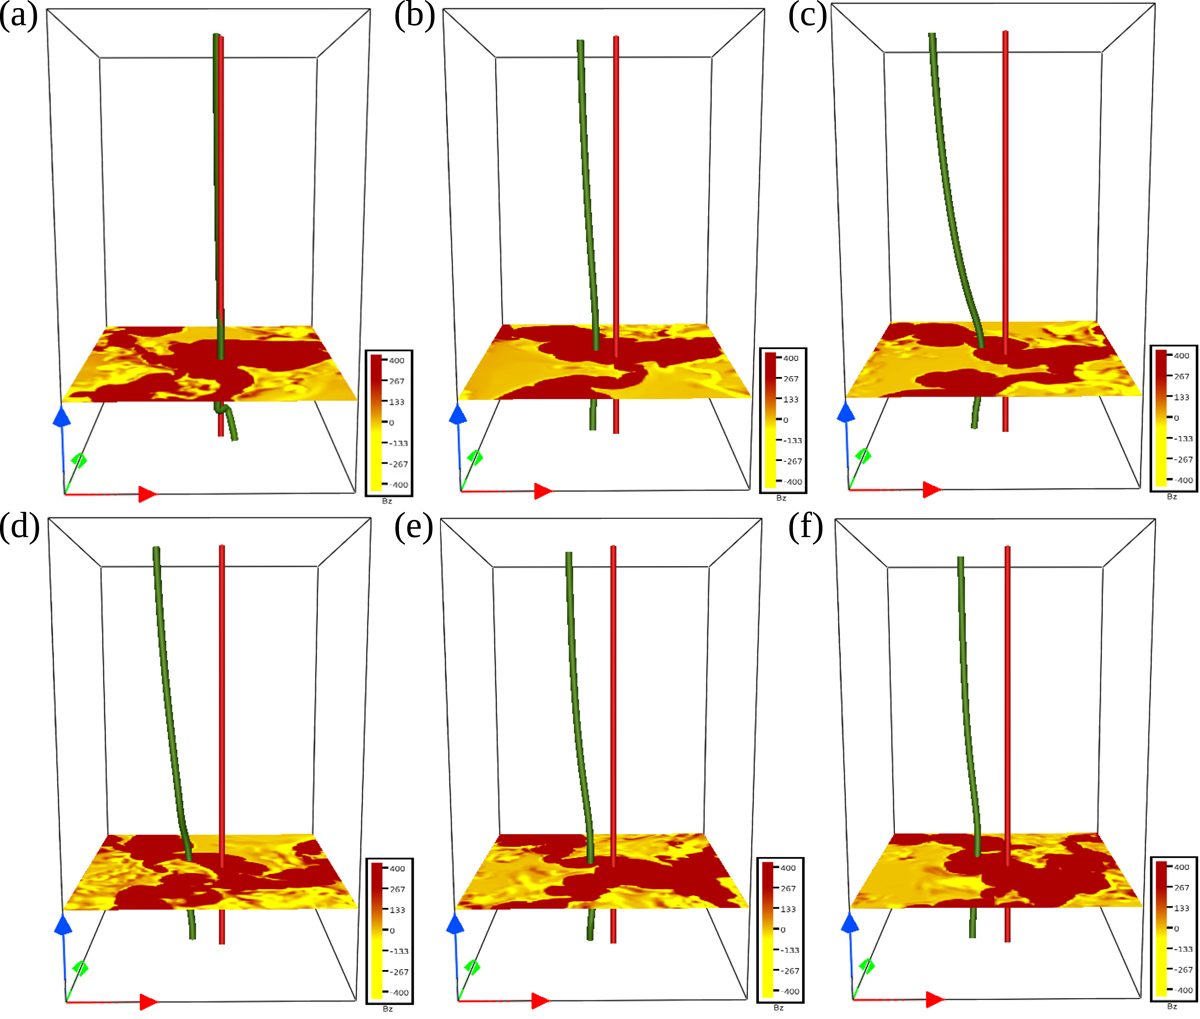
Three-dimensional visualization of magnetic field line (green) corresponding to the seed point shown as a cyan asterisk in Fig. 1. The horizontal extent corresponds to the region shown in Fig. 1b. Panels a–f correspond to snapshots at every 5 min starting from t = 0 (the same instance as in Fig. 1). The red vertical line corresponds to the initial location of the seed point. Saturated maps of magnetic field strength at the mean solar surface are also shown for each temporal snapshot.
Current usage metrics show cumulative count of Article Views (full-text article views including HTML views, PDF and ePub downloads, according to the available data) and Abstracts Views on Vision4Press platform.
Data correspond to usage on the plateform after 2015. The current usage metrics is available 48-96 hours after online publication and is updated daily on week days.
Initial download of the metrics may take a while.