Fig. 10.
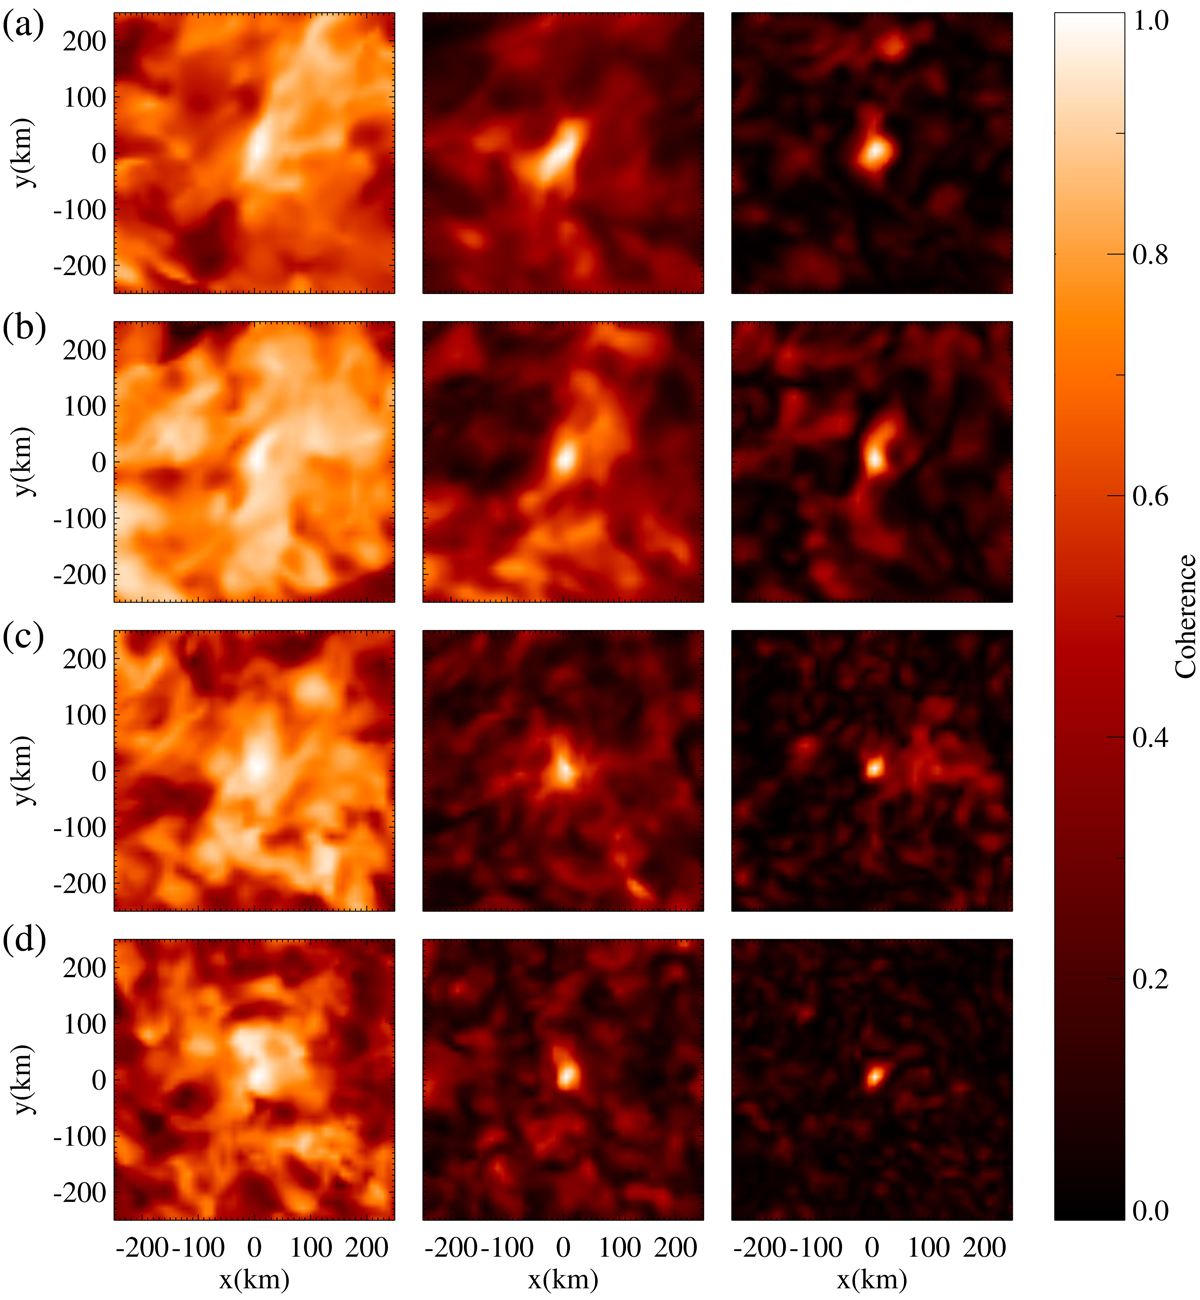
2D maps of coherence between the time series at the initial seed location (identified by the cyan asterisk in Fig. 1) and at surrounding locations at different heights viz. (a) 1500 km, (b) 1000 km, (c) 500 km and (d) 250 km above the mean solar surface. The plotted region corresponds to the dashed square in the rightmost panel of Fig. 1. Left, middle, and right columns correspond to average coherence in the frequency range of 2–5 mHz, 6–10 mHz, 20–25 mHz, respectively.
Current usage metrics show cumulative count of Article Views (full-text article views including HTML views, PDF and ePub downloads, according to the available data) and Abstracts Views on Vision4Press platform.
Data correspond to usage on the plateform after 2015. The current usage metrics is available 48-96 hours after online publication and is updated daily on week days.
Initial download of the metrics may take a while.