Fig. 1.
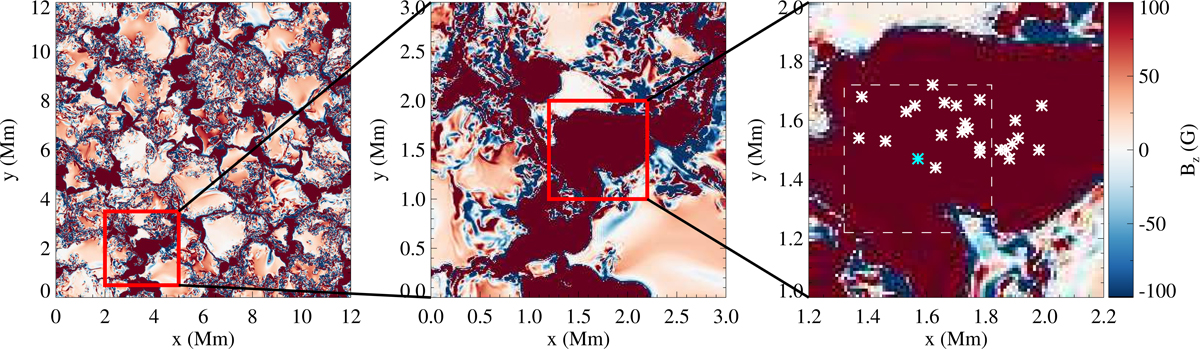
2D maps of the vertical component of the magnetic field vector and initial locations of seed points. Left: 2D map of the vertical component of the magnetic field vector at z = 0 layer (corresponding to average τ = 1 layer) covering the whole horizontal extent of the simulation domain (saturated at ±100 G), middle: blowup displaying the sub-region (red box in the left panel) selected for magneto-acoustic wave analysis. Right: blowup displaying the seed locations (see main text for details). The dashed square in the rightmost panel covers the region shown in Fig. 10.
Current usage metrics show cumulative count of Article Views (full-text article views including HTML views, PDF and ePub downloads, according to the available data) and Abstracts Views on Vision4Press platform.
Data correspond to usage on the plateform after 2015. The current usage metrics is available 48-96 hours after online publication and is updated daily on week days.
Initial download of the metrics may take a while.