Open Access
Fig. C.1
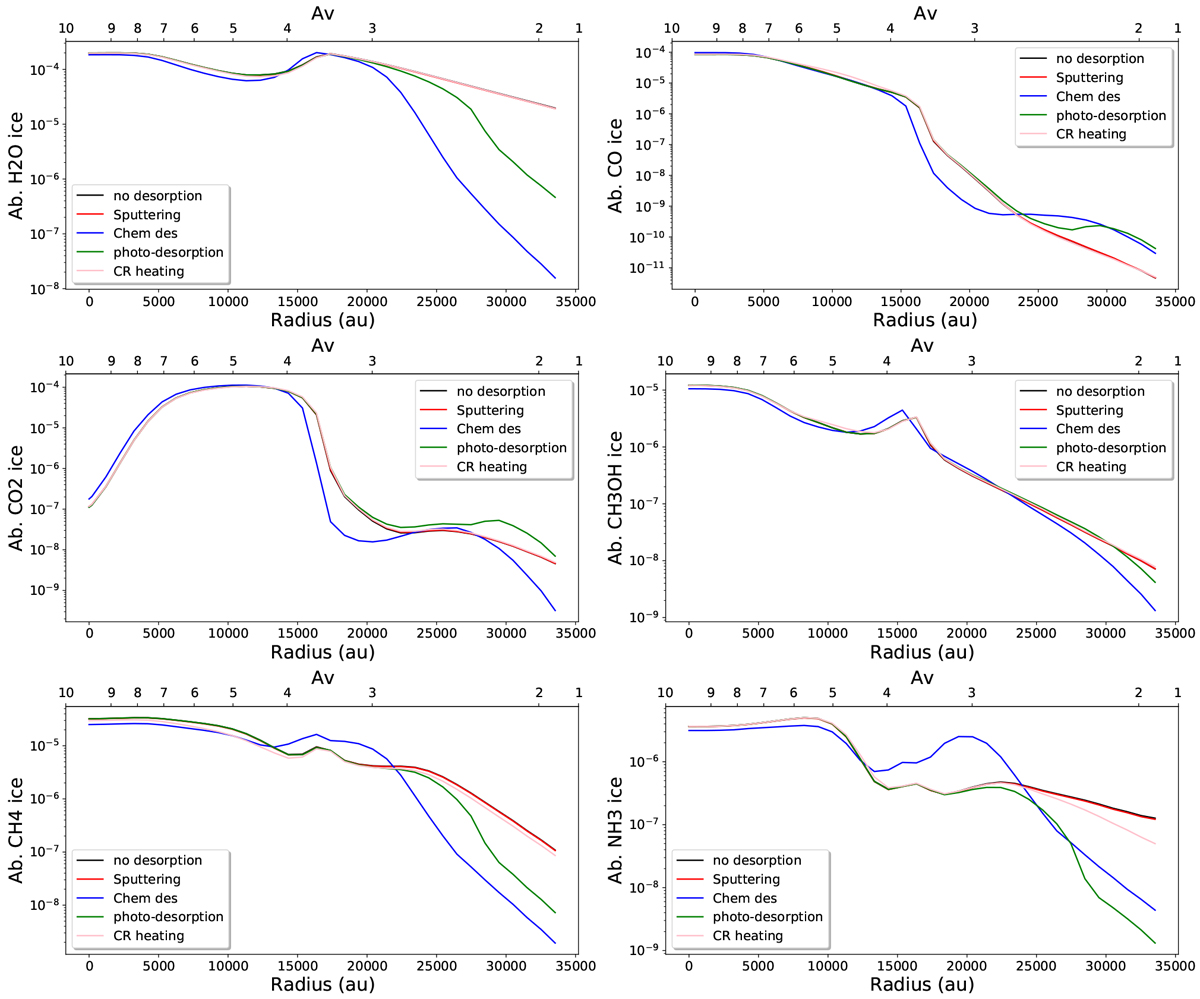
Abundance of the main ice components as a function of radius (and visual extinction) for a time of 6 × 10⁵ yr, and the model in which the dust temperature is set equal to the gas one. The “no desorption” curve is almost the same as the “sputtering” one.
Current usage metrics show cumulative count of Article Views (full-text article views including HTML views, PDF and ePub downloads, according to the available data) and Abstracts Views on Vision4Press platform.
Data correspond to usage on the plateform after 2015. The current usage metrics is available 48-96 hours after online publication and is updated daily on week days.
Initial download of the metrics may take a while.