Open Access
Fig. B.1
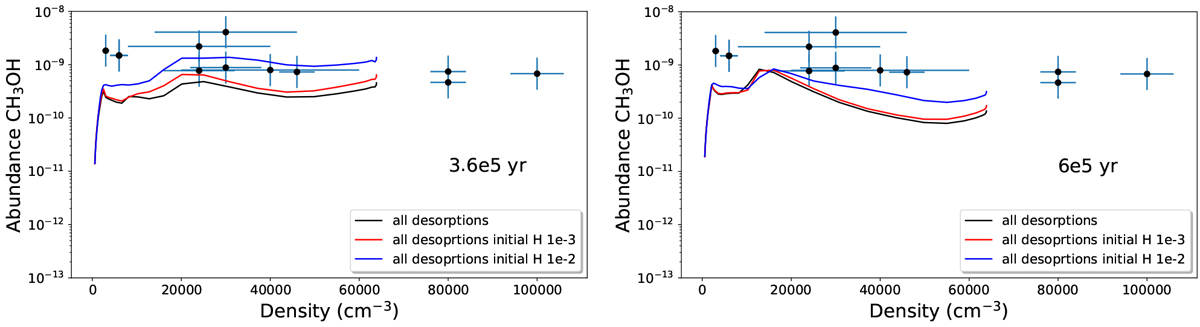
Abundance of gas-phase methanol as a function of H density (in cm−3) in the case of the model starting with initial abundances of zero, 10−3, and 10−2. Two times are shown: 3.6 × 10⁵ and 6 × 10⁵ yr. The points are the observed abundances as described in the text. In all cases, all the desorption mechanisms were included.
Current usage metrics show cumulative count of Article Views (full-text article views including HTML views, PDF and ePub downloads, according to the available data) and Abstracts Views on Vision4Press platform.
Data correspond to usage on the plateform after 2015. The current usage metrics is available 48-96 hours after online publication and is updated daily on week days.
Initial download of the metrics may take a while.