Fig. 8.
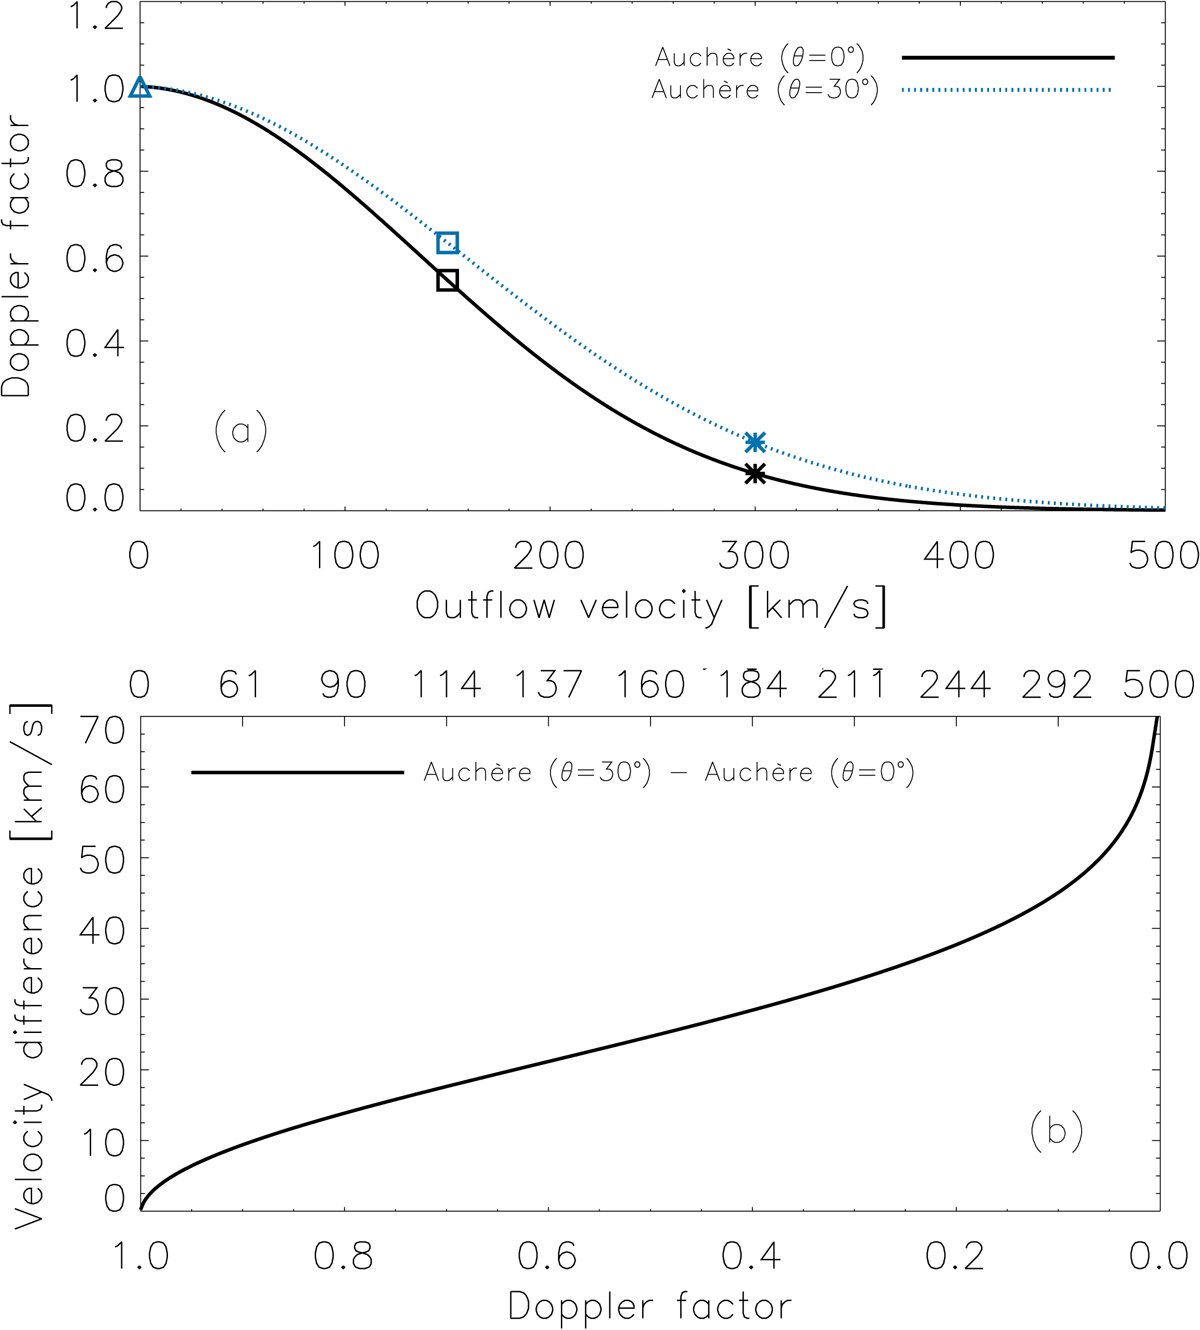
Panel a: Doppler factor as a function of vw calculated considering the normalised Auchère (2005) profile when θ = 0° and θ = 30°. Triangles, squares, and asterisks: see Fig. 3. Panel b: absolute values of the outflow velocity differences determined considering the normalised Auchère (2005) profile when θ = 0° and θ = 30°, as a function of the Doppler factor. The top axis scale shows the velocity values corresponding to the Doppler factor values when the Auchère (2005) profile is taken into account and θ = 0°.
Current usage metrics show cumulative count of Article Views (full-text article views including HTML views, PDF and ePub downloads, according to the available data) and Abstracts Views on Vision4Press platform.
Data correspond to usage on the plateform after 2015. The current usage metrics is available 48-96 hours after online publication and is updated daily on week days.
Initial download of the metrics may take a while.