Fig. 6.
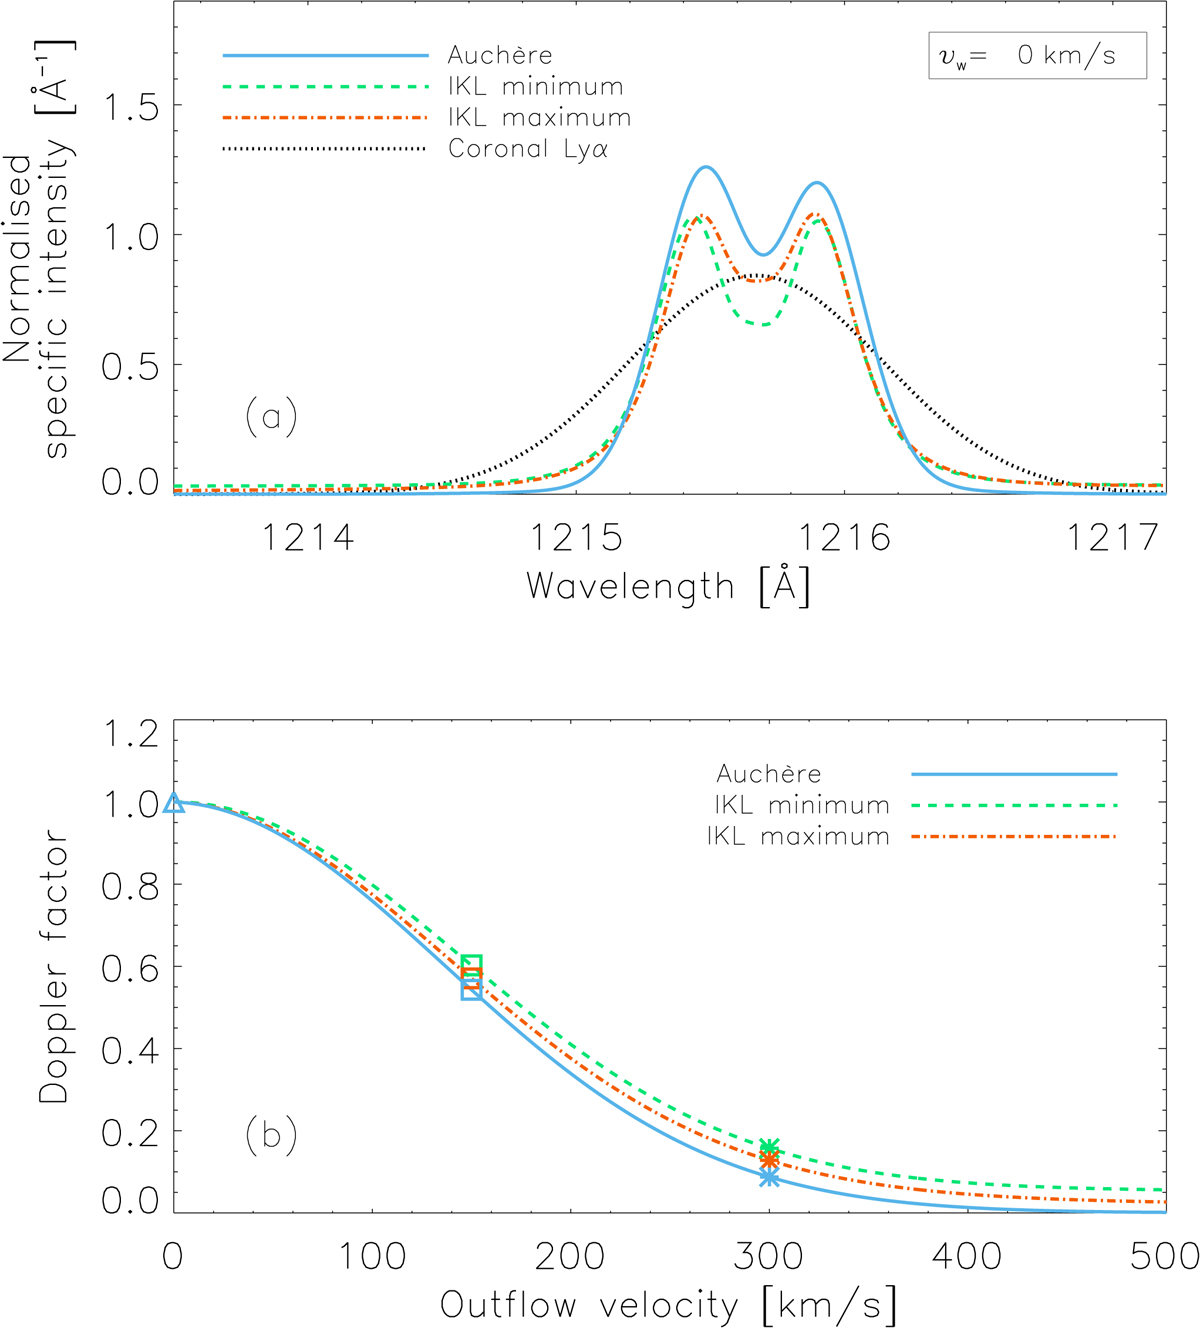
Panel a: normalised parametrised chromospheric profiles reported in Fig. 2; Auchère (2005; blue solid line) and Kowalska-Leszczynska et al. (2018; green dashed line at minimum and red dot-dashed line at maximum), overlapped with a normalised Gaussian coronal profile (black dotted line) computed by setting the coronal H I temperature at 1.5 × 10⁶ K, considering θ = 0°. Panel b: Doppler factor relative to the profiles shown in panel a. Triangles, squares, and asterisks: see Fig. 3.
Current usage metrics show cumulative count of Article Views (full-text article views including HTML views, PDF and ePub downloads, according to the available data) and Abstracts Views on Vision4Press platform.
Data correspond to usage on the plateform after 2015. The current usage metrics is available 48-96 hours after online publication and is updated daily on week days.
Initial download of the metrics may take a while.