Fig. 4.
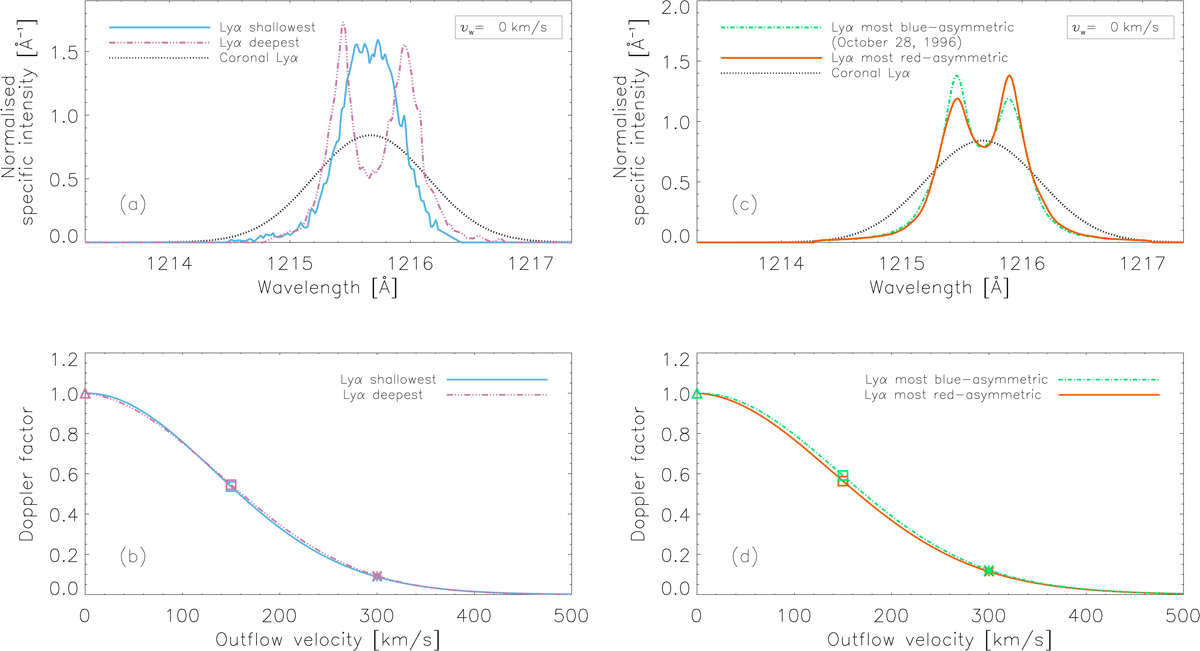
Panel a: normalised shallowest (blue solid line) and deepest (magenta dash-dot-dot-dot line) profiles described in Figs. 6a and 12 of Fontenla et al. (1988), respectively, overlapped with a normalised Gaussian coronal profile (black dotted line) computed by setting the coronal H I temperature at 1.5 × 10⁶ K, considering θ = 0°. Panel b: Doppler factor as a function of vw calculated considering each chromospheric profile. Triangles, squares, and asterisks: see Fig. 3. Panels c and d: same as in panels a and b, but concerning the bluest asymmetric profile (I peak − blue/I peak − red = 1.16) observed on October 28, 1996 (green dash-dotted line; Lemaire et al. 2015) and the reddest asymmetric profile (I peak − blue/I peak − red = 0.86; red solid line), respectively.
Current usage metrics show cumulative count of Article Views (full-text article views including HTML views, PDF and ePub downloads, according to the available data) and Abstracts Views on Vision4Press platform.
Data correspond to usage on the plateform after 2015. The current usage metrics is available 48-96 hours after online publication and is updated daily on week days.
Initial download of the metrics may take a while.