Fig. 3.
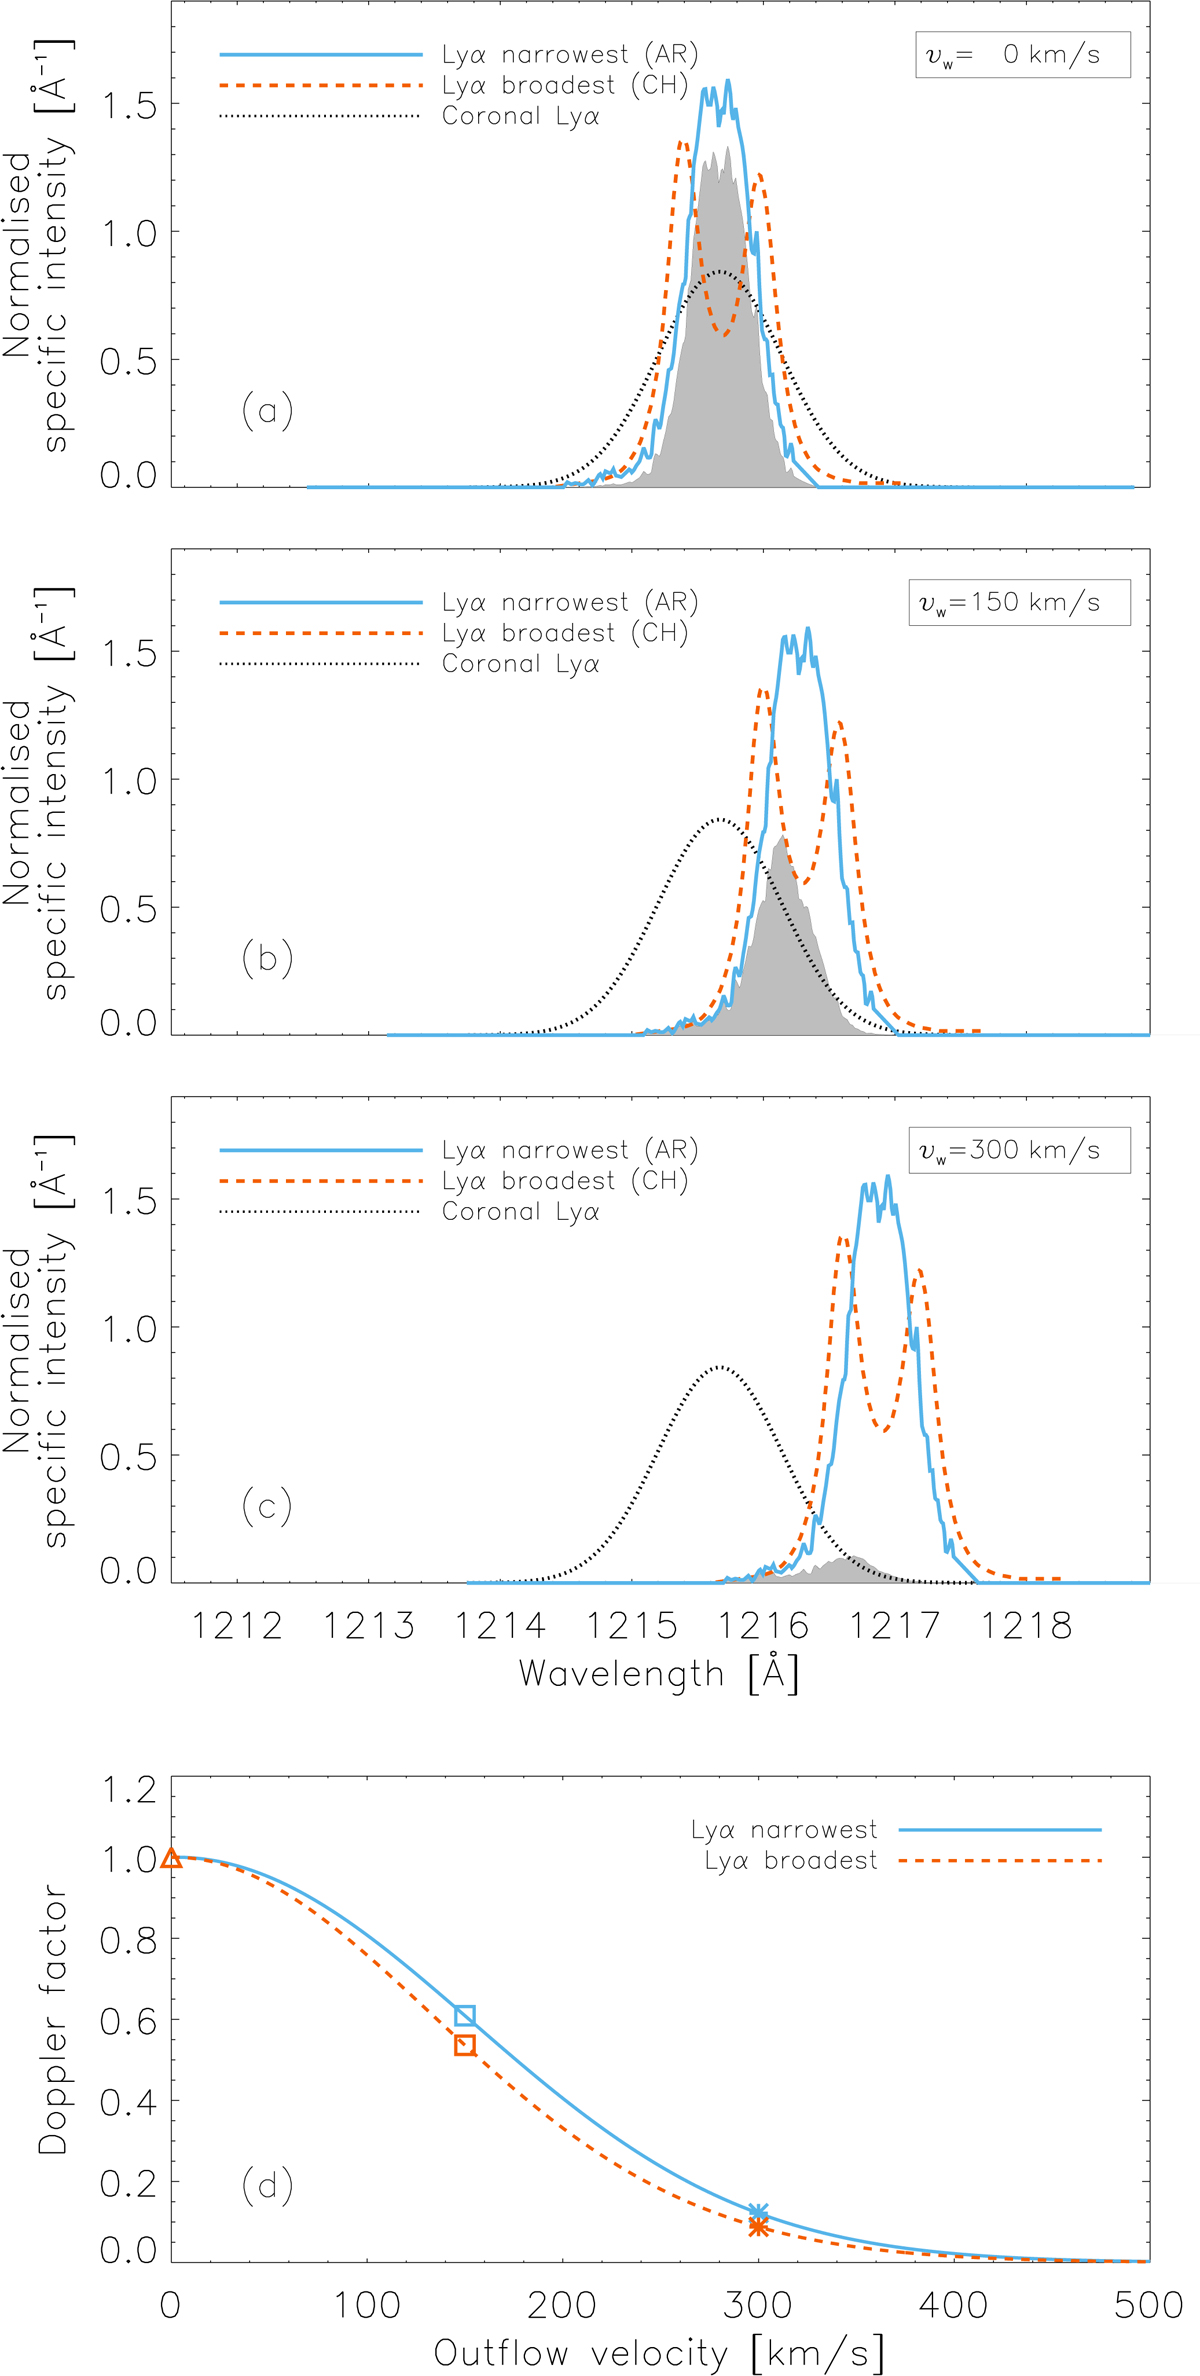
Panels a–c: normalised chromospheric profiles reported in Fig. 12 of Fontenla et al. (1988; AR 2340, blue solid line) and observed on April 17, 2009 (red dashed line; Tian et al. 2009b), overlapped with a normalised Gaussian coronal absorption profile (black dotted line) computed by setting the coronal H I temperature to 1.5 × 10⁶ K, considering θ = 0°. Panels a–c: correspond to outflow velocities equal to vw = 0 km s−1, vw = 150 km s−1, and vw = 300 km s−1, respectively. In the case of the exciting narrowest profile, we also display the grey shaded area that is proportional to the product of the coronal absorption profile (Φ) and the chromospheric pumping profile (Ψ). Panel d: Doppler factor as a function of vw calculated considering each chromospheric profile (AR 2340: blue solid line; polar CH: red dashed line). Triangles, squares and asterisks indicate the Doppler dimming values corresponding to H I outflow velocities equal to vw = 0 km s−1, vw = 150 km s−1, and vw = 300 km s−1, respectively.
Current usage metrics show cumulative count of Article Views (full-text article views including HTML views, PDF and ePub downloads, according to the available data) and Abstracts Views on Vision4Press platform.
Data correspond to usage on the plateform after 2015. The current usage metrics is available 48-96 hours after online publication and is updated daily on week days.
Initial download of the metrics may take a while.