Fig. 10.
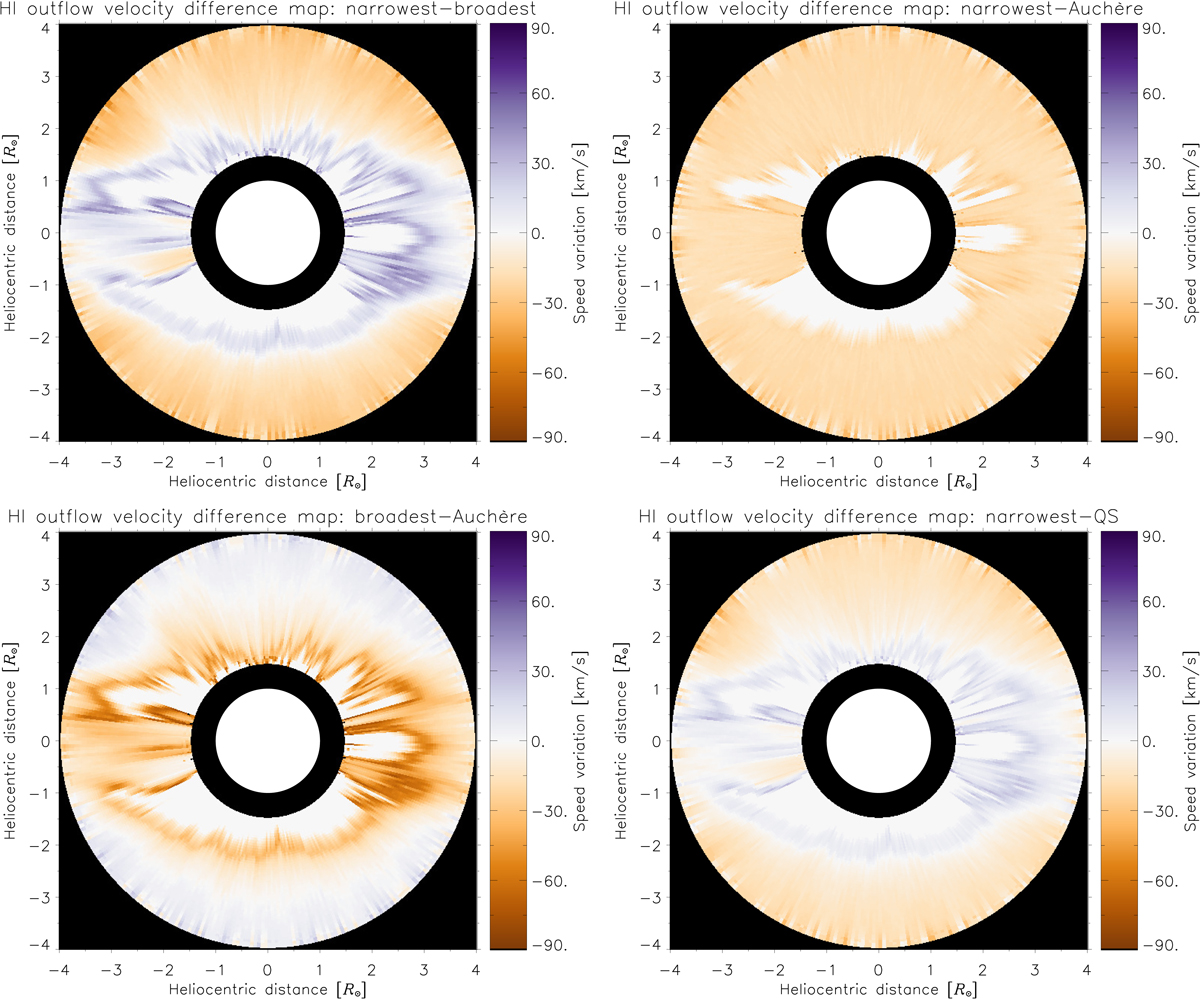
Differences between solar wind H I outflow velocity maps obtained considering the narrowest profile (AR 2340; Fontenla et al. 1988) and the broadest one (polar CH – April 17, 2009; Tian et al. 2009b; top left panel), the narrowest and the Auchère (2005) analytic profiles (top right panel), the broadest and the Auchère (2005) analytic profiles (bottom left panel), and the narrowest profile with that observed on September 23, 2008 (QS; Tian et al. 2009b; bottom right panel).
Current usage metrics show cumulative count of Article Views (full-text article views including HTML views, PDF and ePub downloads, according to the available data) and Abstracts Views on Vision4Press platform.
Data correspond to usage on the plateform after 2015. The current usage metrics is available 48-96 hours after online publication and is updated daily on week days.
Initial download of the metrics may take a while.