Fig. 9.
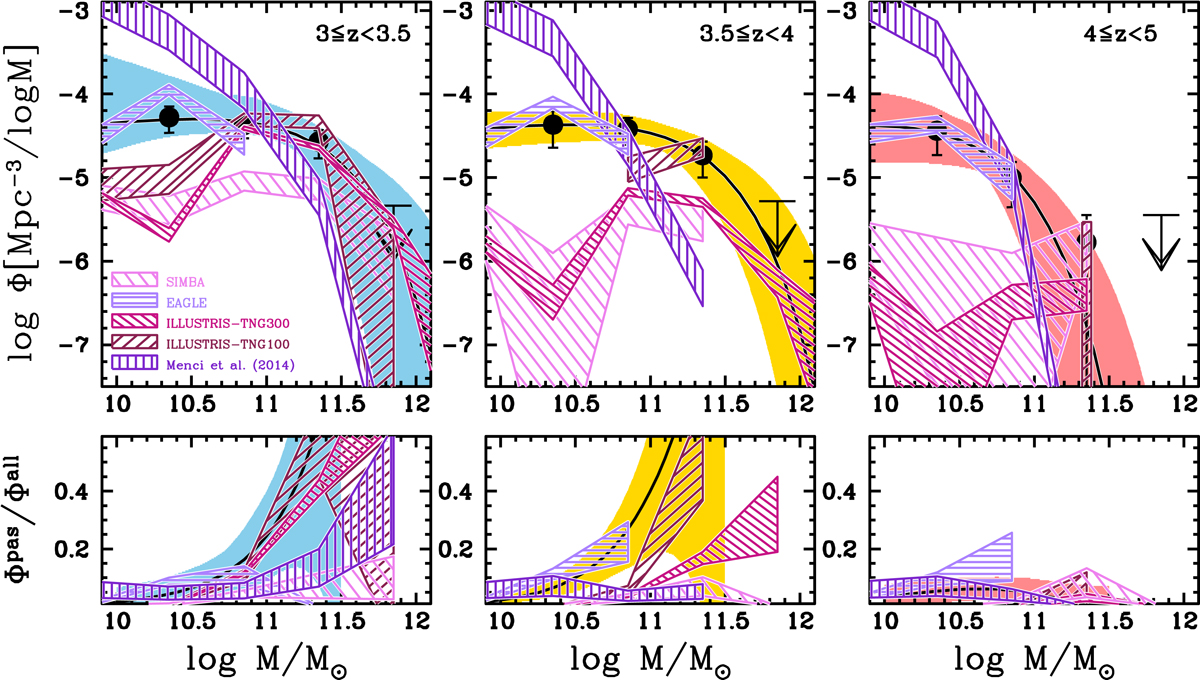
Upper panels: observed SMF for passive galaxies (black points and curves, coloured solid shaded regions) compared to the theoretical predictions of the semi-analytic model of Menci et al. (2014) and the hydrodynamic simulations ILLUSTRIS-TNG100, ILLUSTRIS-TNG300, EAGLE, and SIMBA (see legend), scaled to a Salpeter IMF. The bins where the number of model passive galaxies is null are not shown. Lower panels: ratio of the passive to the global SMF. The coloured solid shaded area and solid curves show the observed fraction, as in Fig. 7. The open shaded regions show model predictions, according to the legend.
Current usage metrics show cumulative count of Article Views (full-text article views including HTML views, PDF and ePub downloads, according to the available data) and Abstracts Views on Vision4Press platform.
Data correspond to usage on the plateform after 2015. The current usage metrics is available 48-96 hours after online publication and is updated daily on week days.
Initial download of the metrics may take a while.