Fig. 8.
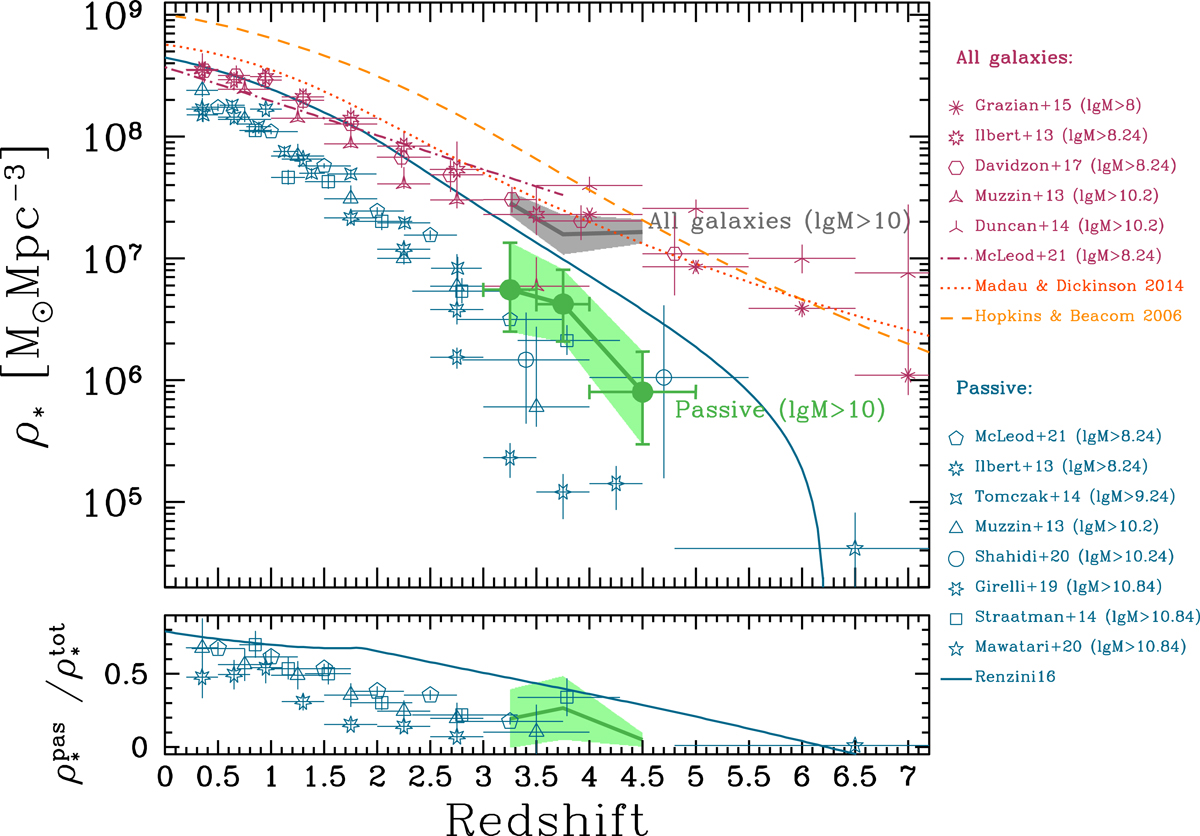
Upper panel: evolution in the SMD of passive galaxies above 1010 M⊙ (green symbols and shaded area). As for comparison, the SMD of all H < 27 galaxies integrated above the same mass limit is also plotted (shaded grey region). In both cases, the shaded regions represent the 1σ uncertainty. The results are compared to a number of literature works, as listed in the legend, for passive galaxies (open blue symbols) and for the entire population (open dark red symbols and dot dashed line). The literature estimates and their mass integration limits have been scaled to a Salpeter IMF, when needed. The dashed orange and dotted red lines indicate the SMD derived by integrating SFR density from Hopkins & Beacom (2006) and Madau & Dickinson (2014), respectively, assuming a constant recycle fraction of 28%. The solid blue line shows the prediction for the SMD in passive galaxies by Renzini (2016). Lower panel: ratio of the mass density of passive galaxies to the overall galaxy population above 1010 M⊙ (solid green line and solid region). The passive fractions in terms of mass densities measured by Muzzin et al. (2013; triangles), Straatman et al. (2014; squares), Ilbert et al. (2013; 7-point stars), McLeod et al. (2021; pentagons), Mawatari et al. (2020; 5-point star), and predicted by Renzini (2016; solid line) are shown.
Current usage metrics show cumulative count of Article Views (full-text article views including HTML views, PDF and ePub downloads, according to the available data) and Abstracts Views on Vision4Press platform.
Data correspond to usage on the plateform after 2015. The current usage metrics is available 48-96 hours after online publication and is updated daily on week days.
Initial download of the metrics may take a while.