Fig. 7.
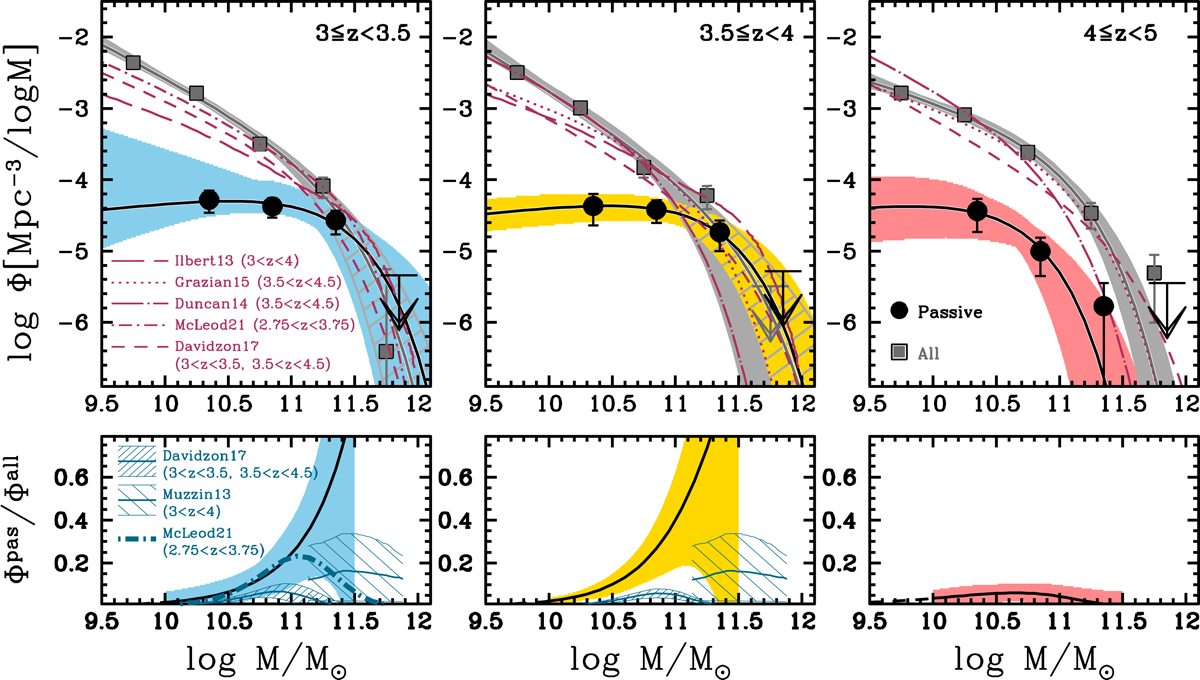
Upper panels: SMF of passive candidates (black circles and curves, coloured shaded regions) vs. all H < 27 galaxies (grey squares and curves, shaded grey regions). The shaded regions indicate the regions at 68% confidence level considering the joint probability distribution function of the Schechter parameters. The dark red curves show SMF from the literature in similar, but not identical, redshift bins (as indicated in the legend), all scaled to the same IMF: Ilbert et al. (2013; long-dashed line), Duncan et al. (2014; dot long-dashed line), Grazian et al. (2015; dotted line), Davidzon et al. (2017; dashed line), and McLeod et al. (2021; dot short-dashed line). Lower panels: ratio of the passive and global Schechter functions. The shaded area and solid curve show the mass range where the comparison is meaningful (i.e. not affected by paucity of galaxies nor extrapolated due to the lack of observational data). We also show the passive fractions published by Davidzon et al. (2017; narrow-spaced shaded area) and Muzzin et al. (2013; wide-spaced shaded area), and the ratio of the passive to the total SMF of McLeod et al. (2021; dot dashed line).
Current usage metrics show cumulative count of Article Views (full-text article views including HTML views, PDF and ePub downloads, according to the available data) and Abstracts Views on Vision4Press platform.
Data correspond to usage on the plateform after 2015. The current usage metrics is available 48-96 hours after online publication and is updated daily on week days.
Initial download of the metrics may take a while.