Fig. 4.
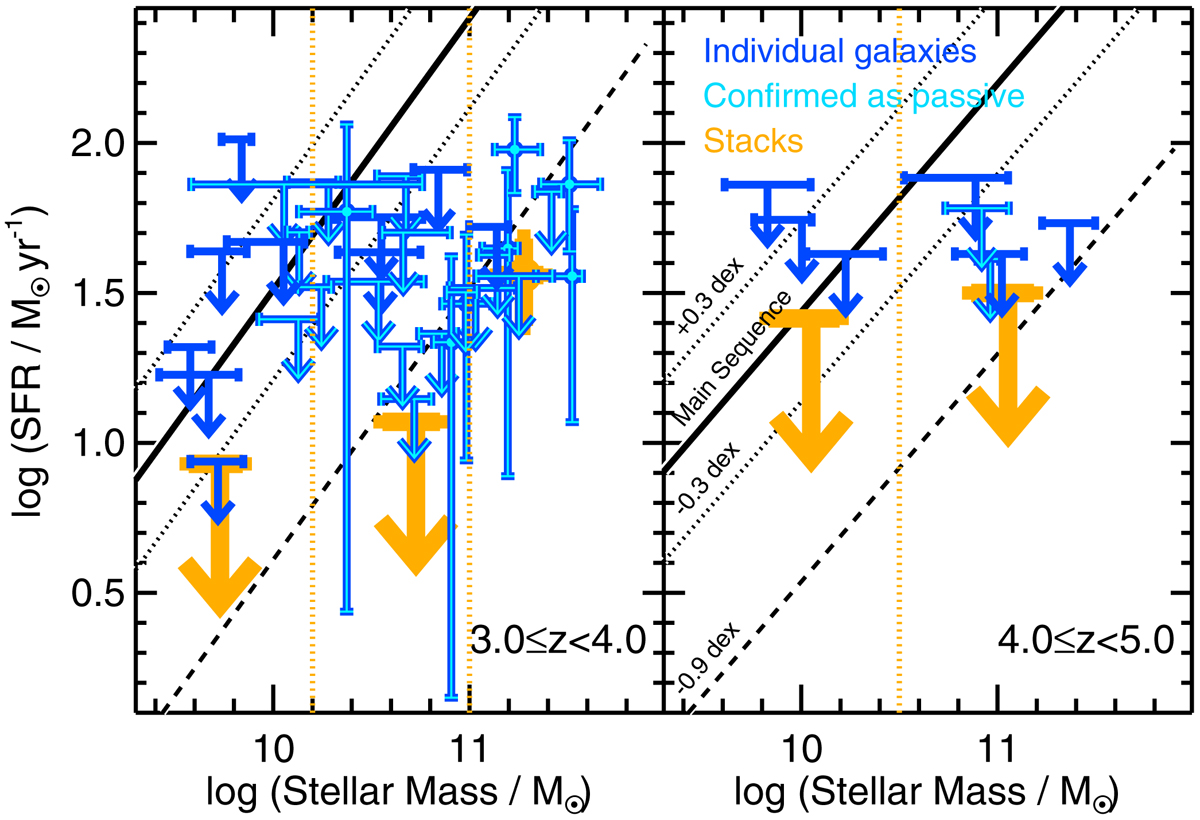
Location of the passive candidates observed by ALMA on a SFR-stellar mass diagram, in two redshift bins, based on their sub-millimetre SFR. The arrows represent 1σ upper limits on the SFR. The 1σ error bars on the stellar masses have been conservatively calculated by setting the redshift as a free parameter. The solid lines show the observed MS of Santini et al. (2017). The dotted lines are 1σ above and below the MS (estimated from the observed 0.3 dex scatter), while the dashed line is 3σ below the MS. Individual sources are shown in blue. Robust candidates (i.e. individually confirmed as passive at a 3σ confidence level) have been overplotted in light blue. The large orange symbols show the stacks in bins of stellar mass, denoted by the vertical dotted orange lines.
Current usage metrics show cumulative count of Article Views (full-text article views including HTML views, PDF and ePub downloads, according to the available data) and Abstracts Views on Vision4Press platform.
Data correspond to usage on the plateform after 2015. The current usage metrics is available 48-96 hours after online publication and is updated daily on week days.
Initial download of the metrics may take a while.