Fig. 3.
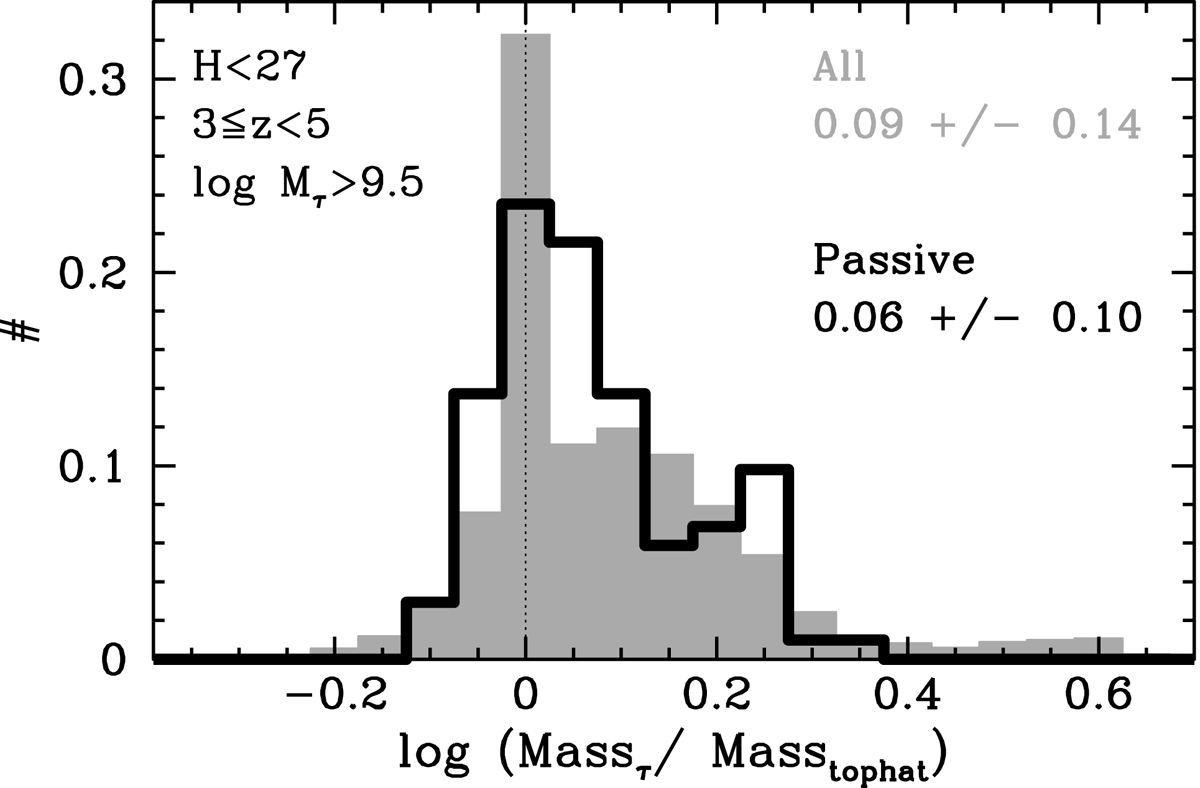
Distribution of the ratio of the stellar mass computed with τ-models to those with top-hat SFHs. The shaded grey histogram refers to the total population of H < 27 galaxies at 3 ≤ z < 5 with Mτ > 109.5 M⊙ in the five CANDELS fields, while the open black histogram shows the passive candidates. The numbers in the upper right corner show the mean and standard deviation of the two distributions.
Current usage metrics show cumulative count of Article Views (full-text article views including HTML views, PDF and ePub downloads, according to the available data) and Abstracts Views on Vision4Press platform.
Data correspond to usage on the plateform after 2015. The current usage metrics is available 48-96 hours after online publication and is updated daily on week days.
Initial download of the metrics may take a while.