Fig. 10.
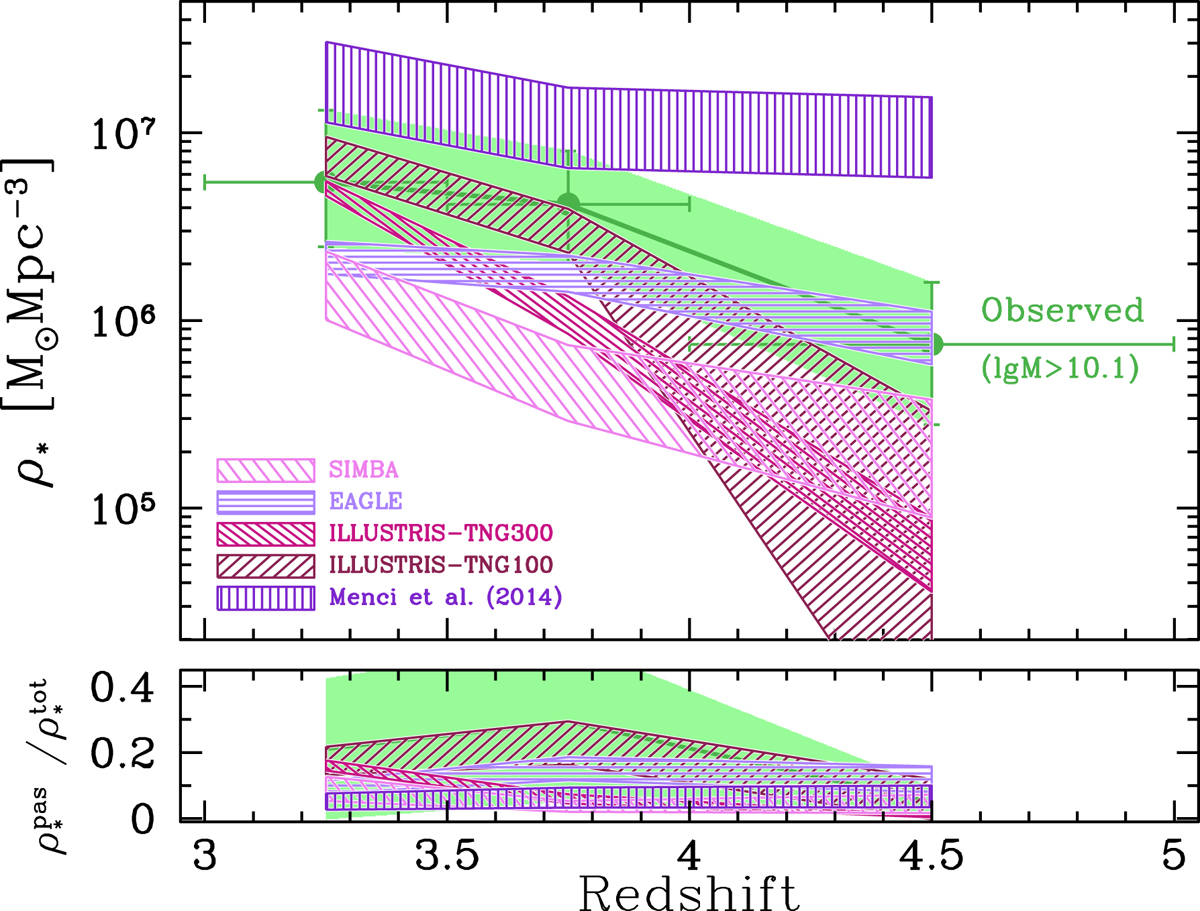
Upper panel: evolution in the SMD of passive galaxies above 1010.1 M⊙ (green symbols and solid shaded area) compared to the theoretical predictions of the semi-analytic model of Menci et al. (2014) and the hydrodynamic simulations ILLUSTRIS-TNG100, ILLUSTRIS-TNG300, EAGLE, and SIMBA (see legend), scaled to a Salpeter IMF. Lower panel: ratio of the mass density of passive galaxies to the overall galaxy population above 1010.1 M⊙. The solid green line and solid region show the observed passive fraction, while the open shaded regions indicate model predictions, according to the legend.
Current usage metrics show cumulative count of Article Views (full-text article views including HTML views, PDF and ePub downloads, according to the available data) and Abstracts Views on Vision4Press platform.
Data correspond to usage on the plateform after 2015. The current usage metrics is available 48-96 hours after online publication and is updated daily on week days.
Initial download of the metrics may take a while.