Fig. 7
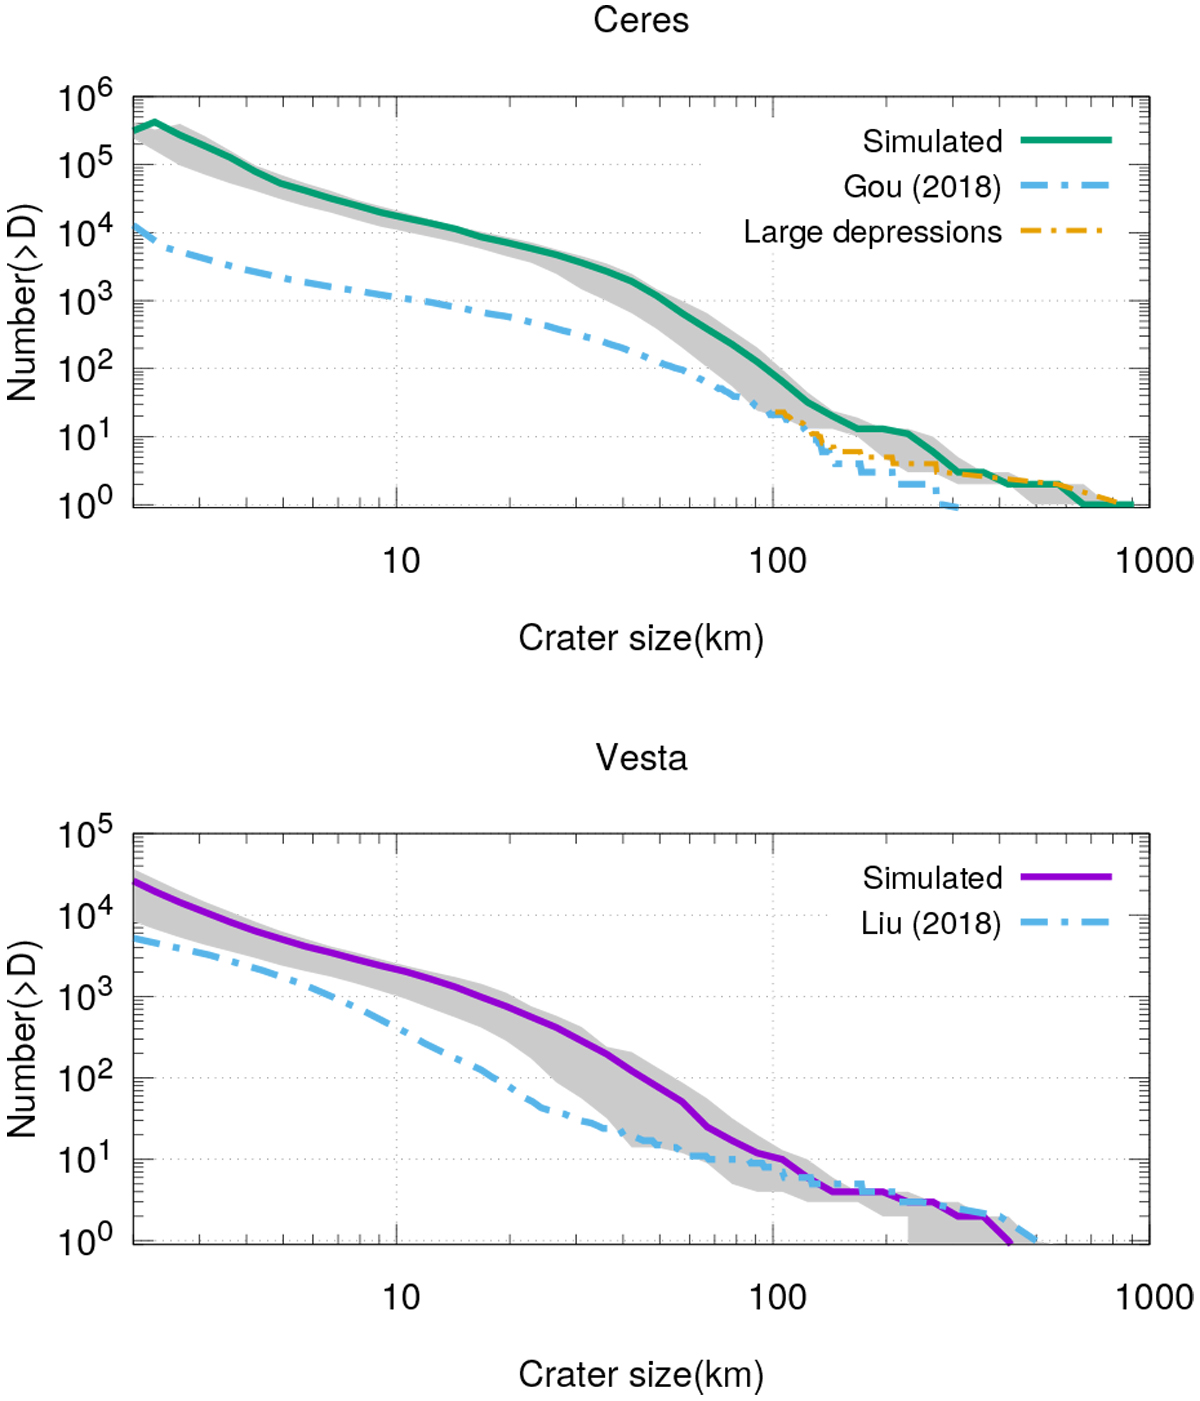
Simulated and observed crater SFD for Ceres (top) and Vesta (bottom) in the run that produces the best fit. The solid line represents an angle of 45° for all impacts, while the top part of the shaded area indicates an impact angle of 90° and the bottom part and angle of 15°. The crater counts were taken from Liu et al. (2018) and Gou et al. (2018). In the case of Ceres (top), a second line is observed, which is made of the crater catalog of Gou et al. (2018) with the addition of two large depressions suggested by Marchi et al. (2016).
Current usage metrics show cumulative count of Article Views (full-text article views including HTML views, PDF and ePub downloads, according to the available data) and Abstracts Views on Vision4Press platform.
Data correspond to usage on the plateform after 2015. The current usage metrics is available 48-96 hours after online publication and is updated daily on week days.
Initial download of the metrics may take a while.