Fig. 7.
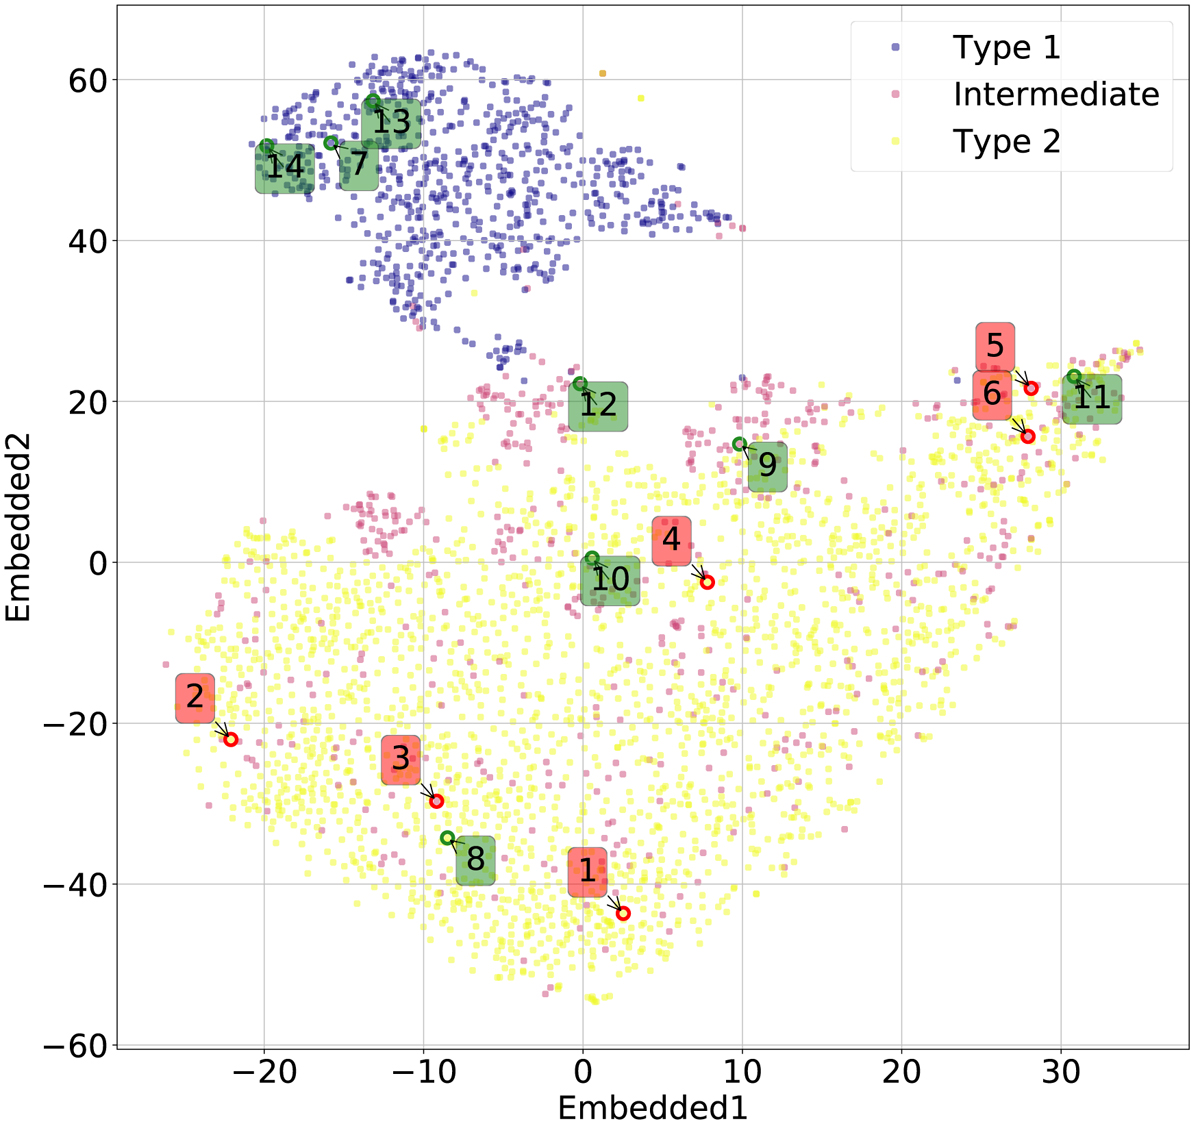
Randomly selected spectra for which there are computed and visualized saliency maps, shown in the t-SNE embedded plane. Spectra that were correctly classified by our SVM are shown in green, while misclassified spectra are shown in red. Color-coding for the points as in Fig. 4. Green rectangles: correctly classified spectra for which saliency maps were calculated; red rectangles: misclassified spectra for which saliency maps were calculated.
Current usage metrics show cumulative count of Article Views (full-text article views including HTML views, PDF and ePub downloads, according to the available data) and Abstracts Views on Vision4Press platform.
Data correspond to usage on the plateform after 2015. The current usage metrics is available 48-96 hours after online publication and is updated daily on week days.
Initial download of the metrics may take a while.