Fig. 5.
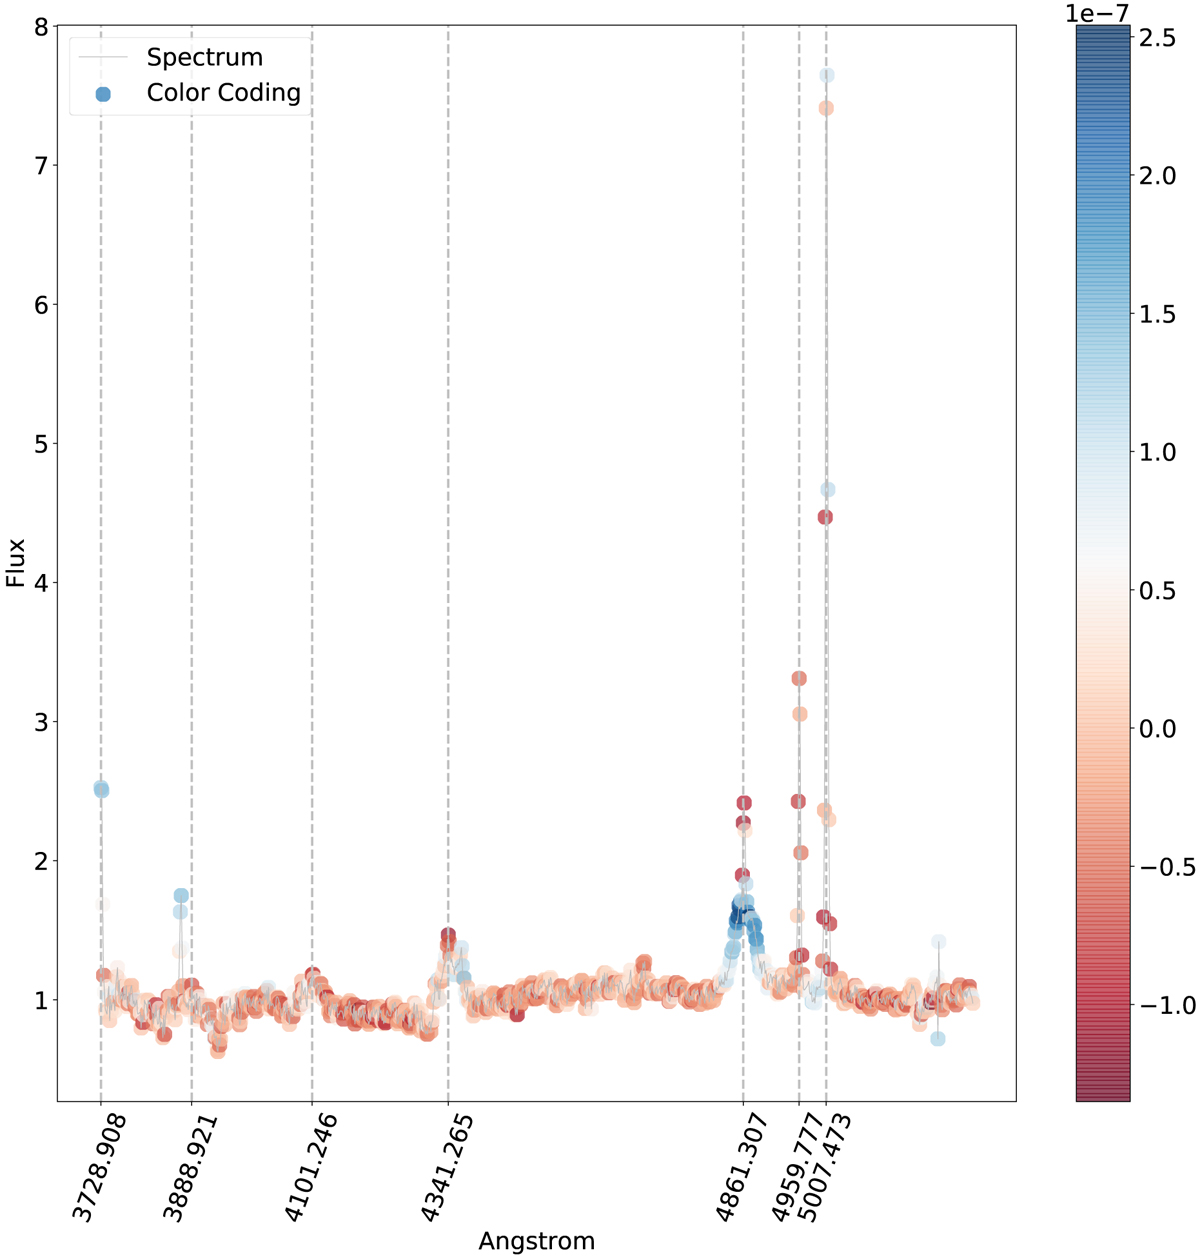
Intermediate-type spectrum correctly classified by our SVM. The regions of the spectrum shown in blue are those that most contributed toward its classification as an intermediate-type, whereas those shown in red would reduce the SVM classification confidence if their flux increased. Several regions surrounding lines conventionally used for classification appear in blue, suggesting that our SVM model relied, in this case, on clues similar to those used by human experts; in particular, the center of the Hβ line appears in red and the tails in blue, which corresponds to the classifier using the width of the Hβ line for its decision.
Current usage metrics show cumulative count of Article Views (full-text article views including HTML views, PDF and ePub downloads, according to the available data) and Abstracts Views on Vision4Press platform.
Data correspond to usage on the plateform after 2015. The current usage metrics is available 48-96 hours after online publication and is updated daily on week days.
Initial download of the metrics may take a while.