Fig. 5
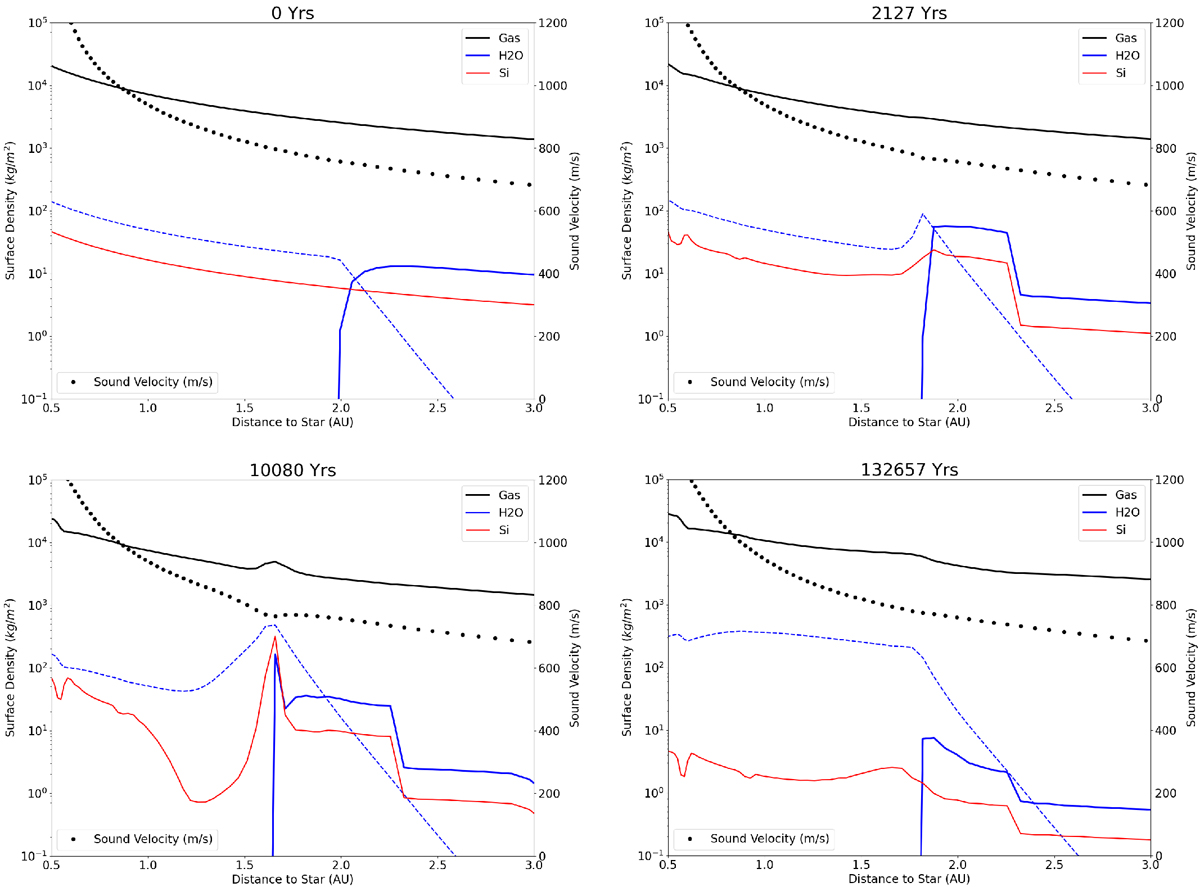
Simulation of a full protoplanetary disk using ![]() given by Eq. (3) and running the code of Charnoz et al. (2019). Only the region around the snow-line is displayed. Solid lines in black, blue, and red represent the gas, water ice, and silicate dust surface densities (respectively), and the dashed blue line shows the water vapor. The black dots display the local sound velocity in m s−1 (right scale).
given by Eq. (3) and running the code of Charnoz et al. (2019). Only the region around the snow-line is displayed. Solid lines in black, blue, and red represent the gas, water ice, and silicate dust surface densities (respectively), and the dashed blue line shows the water vapor. The black dots display the local sound velocity in m s−1 (right scale).
Current usage metrics show cumulative count of Article Views (full-text article views including HTML views, PDF and ePub downloads, according to the available data) and Abstracts Views on Vision4Press platform.
Data correspond to usage on the plateform after 2015. The current usage metrics is available 48-96 hours after online publication and is updated daily on week days.
Initial download of the metrics may take a while.