Free Access
Fig. 5.
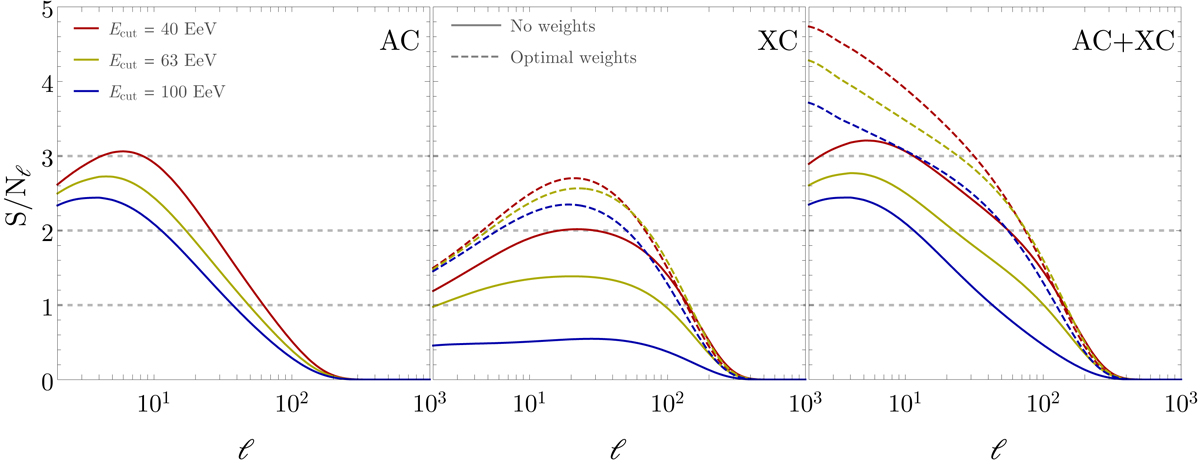
S/N per multipole, S/Nℓ, for the AC signal, the XC signal with both normal and optimal weights, and their combination, AC+XC (leftmost, central, and rightmost panel, respectively). Different colours refer to different energy cuts, and the three horizontal dashed lines show the thresholds for 1, 2, and 3σ detection.
Current usage metrics show cumulative count of Article Views (full-text article views including HTML views, PDF and ePub downloads, according to the available data) and Abstracts Views on Vision4Press platform.
Data correspond to usage on the plateform after 2015. The current usage metrics is available 48-96 hours after online publication and is updated daily on week days.
Initial download of the metrics may take a while.