Fig. 4.
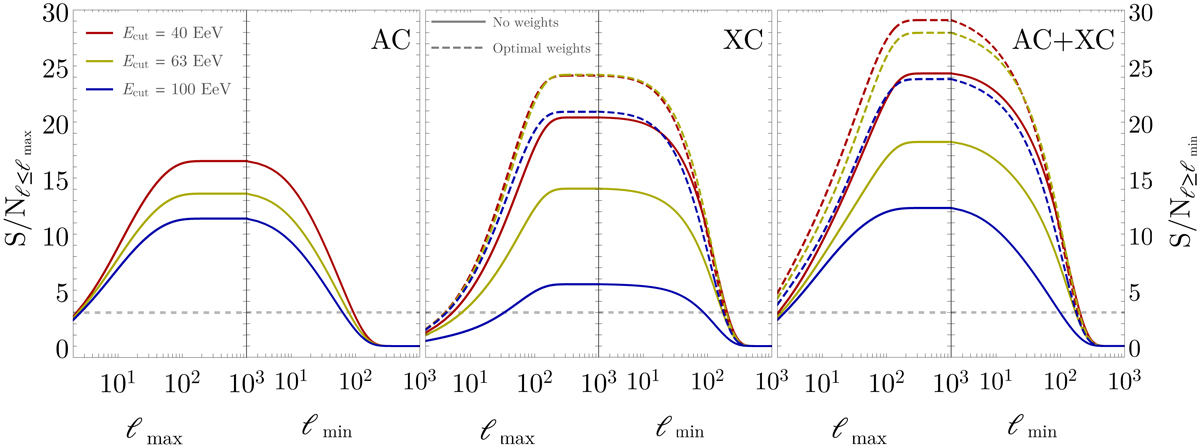
S/N for UHECR flux anisotropies from different combinations of data, namely UHECR AC in the leftmost panel, XC in the central panel, and the combination of all data in the rightmost panel. In each panel, the left half shows the cumulative S/N as a function of the maximum multipole, ℓmax, whereas the right half is for the cumulative S/N as a function of the minimum multipole, ℓmin. The horizontal dashed line marks the 3σ threshold for detection.
Current usage metrics show cumulative count of Article Views (full-text article views including HTML views, PDF and ePub downloads, according to the available data) and Abstracts Views on Vision4Press platform.
Data correspond to usage on the plateform after 2015. The current usage metrics is available 48-96 hours after online publication and is updated daily on week days.
Initial download of the metrics may take a while.