Free Access
Fig. 3.
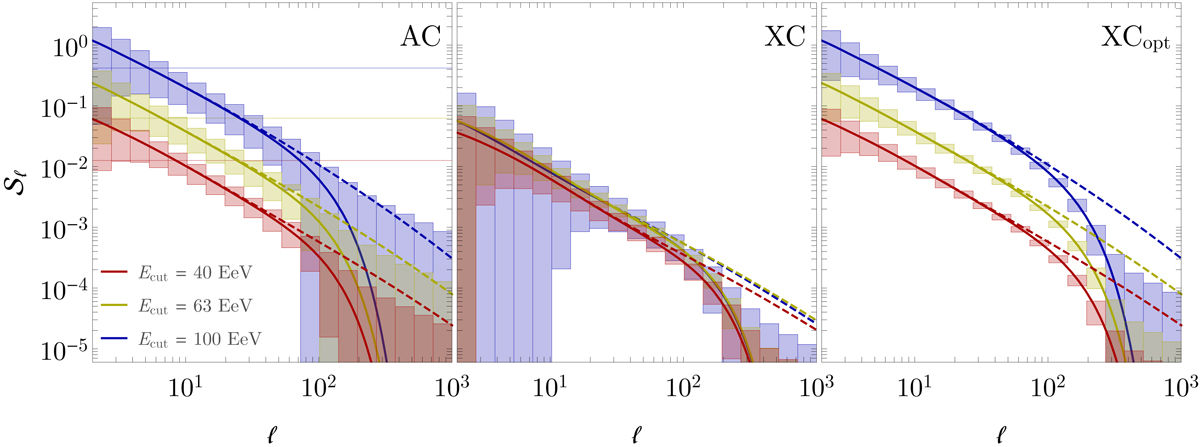
Expected power spectra and ℓ-binned 1σ uncertainties (shaded boxes), including a 1° Gaussian smoothing beam to account for the angular resolution of UHECR experiments (solid curves). For reference, horizontal lines in the leftmost plots denote shot noise levels, and the dashed curves show the beam-free prediction.
Current usage metrics show cumulative count of Article Views (full-text article views including HTML views, PDF and ePub downloads, according to the available data) and Abstracts Views on Vision4Press platform.
Data correspond to usage on the plateform after 2015. The current usage metrics is available 48-96 hours after online publication and is updated daily on week days.
Initial download of the metrics may take a while.