Fig. 1.
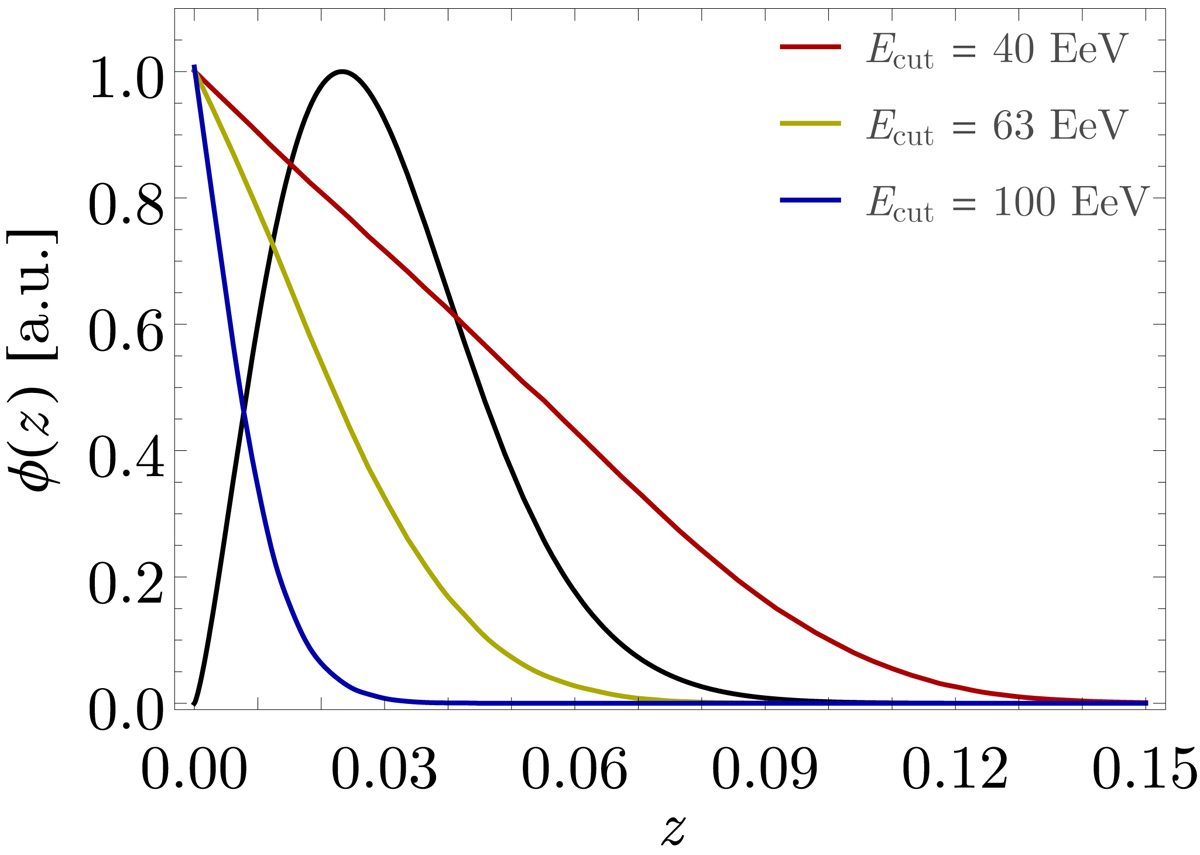
Radial kernels for the two observables under consideration. The solid black line shows the approximate redshift distribution of galaxies in the 2MRS sample using the fit found by Ando et al. (2018). The red, yellow, and blue lines show the radial kernel for the UHECR flux (Eq. (10)) for the three energy thresholds studied here (40 EeV, 63 EeV, and 100 EeV, respectively).
Current usage metrics show cumulative count of Article Views (full-text article views including HTML views, PDF and ePub downloads, according to the available data) and Abstracts Views on Vision4Press platform.
Data correspond to usage on the plateform after 2015. The current usage metrics is available 48-96 hours after online publication and is updated daily on week days.
Initial download of the metrics may take a while.