Fig. 6.
Download original image
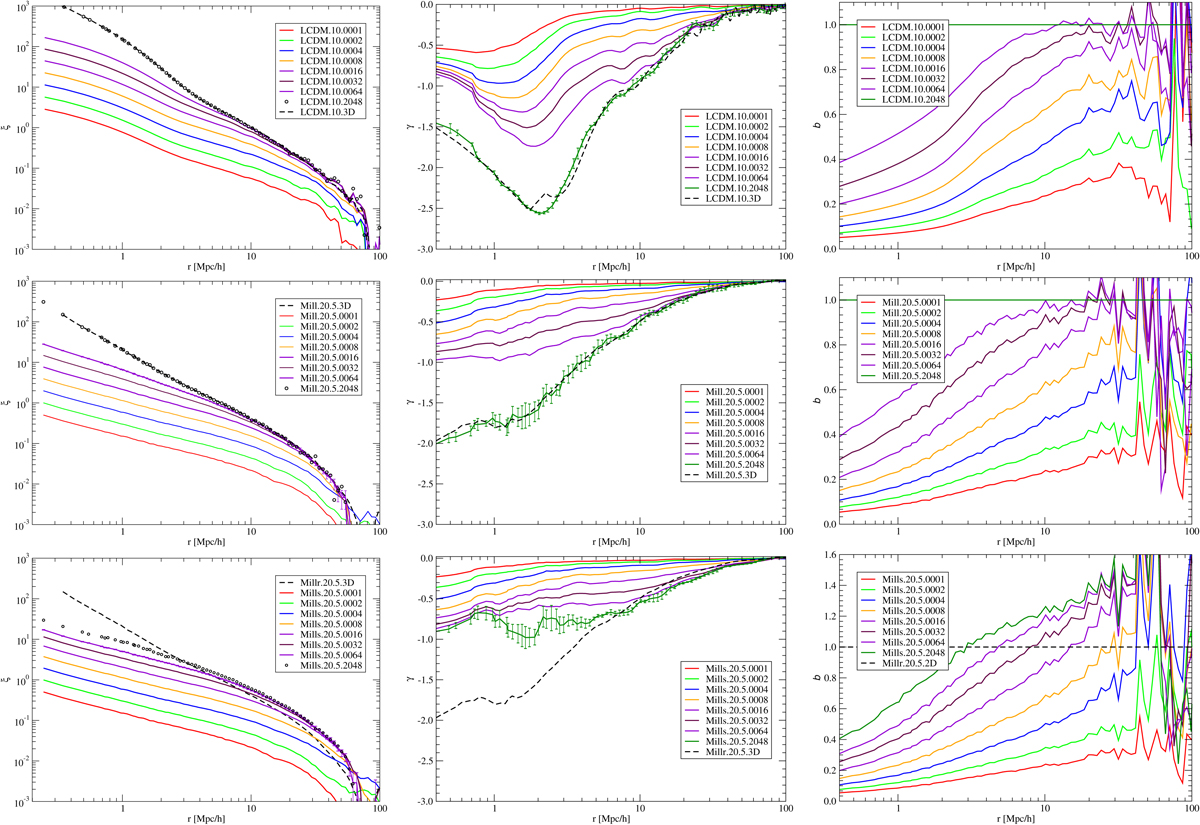
Two-dimensional CFs and related functions for models for different thickness of 2D samples. Top row: LCDM model with particle density limit ρ0 = 10. Second row: Millennium samples with magnitude limit Mr = −20.5 in real space. Bottom row: Millennium samples with magnitude limit Mr = −20.5 in redshift space. Left panels: CFs. Central panels: gradient functions. Right panels: relative bias functions. As argument we use pair separations perpendicular to the line of sight, ![]() . As parameter we use the thickness of samples, L. Lines of various colours mark 2D samples of different thickness. For comparison we show 3D functions for samples with ρ0 = 10 and Mr = −20.5. Error bars are shown for some samples.
. As parameter we use the thickness of samples, L. Lines of various colours mark 2D samples of different thickness. For comparison we show 3D functions for samples with ρ0 = 10 and Mr = −20.5. Error bars are shown for some samples.
Current usage metrics show cumulative count of Article Views (full-text article views including HTML views, PDF and ePub downloads, according to the available data) and Abstracts Views on Vision4Press platform.
Data correspond to usage on the plateform after 2015. The current usage metrics is available 48-96 hours after online publication and is updated daily on week days.
Initial download of the metrics may take a while.