| Issue |
A&A
Volume 652, August 2021
|
|
|---|---|---|
| Article Number | C7 | |
| Number of page(s) | 1 | |
| Section | The Sun and the Heliosphere | |
| DOI | https://doi.org/10.1051/0004-6361/201834296e | |
| Published online | 24 August 2021 | |
Properties of the inner penumbra boundary and temporal evolution of a decaying sunspot (Corrigendum)
1
Astronomical Institute, Slovak Academy of Sciences, 05960 Tatranská Lomnica, Slovak Republic
e-mail: This email address is being protected from spambots. You need JavaScript enabled to view it.
2
Instituto de Astrofísica de Canarias, Vía Láctea s/n, 38205 La Laguna, Tenerife, Spain
3
Departamento de Astrofísica, Universidad de La Laguna, 38205 La Laguna, Tenerife, Spain
4
Leibniz-Istitut für Astrophysik Potsdam (AIP), An der Sternwarte 16, 14482 Potsdam, Germany
5
Astronomical Institute of the Academy of Sciences, Fričova 298, 25165 Ondřejov, Czech Republic
Key words: Sun: photosphere / Sun: activity / methods: observational / methods: data analysis / techniques: high angular resolution / errata, addenda
In our paper, we made a mistake in calculating the magnetic flux values. The penumbra starts with a value of 1.32 × 10²¹ Mx on August 29, 2011, and decreases to 0.58 × 10²¹ Mx on September 3, 2011. The umbra has an initial value of 0.90 × 10²¹ Mx and ends with a value of 0.55 × 10²¹ Mx. The corrected values for the penumbra now more likely have a quadratic trend, although we do not exclude a linear one. The new curves are displayed in Fig. 1, which replaces Fig. 4 in the original paper.
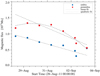 |
Fig. 1. Temporal evolution of the magnetic flux in umbra (blue dots) and penumbra (red dots). The data from August 28 are excluded from the fits because on that day the spot was still in the growing phase. |
Acknowledgments
We are indebted to Dr. Mariarita Murabito for bringing the problem to our attention.
© ESO 2021
All Figures
|
Fig. 1. Temporal evolution of the magnetic flux in umbra (blue dots) and penumbra (red dots). The data from August 28 are excluded from the fits because on that day the spot was still in the growing phase. |
| In the text | |
Current usage metrics show cumulative count of Article Views (full-text article views including HTML views, PDF and ePub downloads, according to the available data) and Abstracts Views on Vision4Press platform.
Data correspond to usage on the plateform after 2015. The current usage metrics is available 48-96 hours after online publication and is updated daily on week days.
Initial download of the metrics may take a while.