Fig. 3.
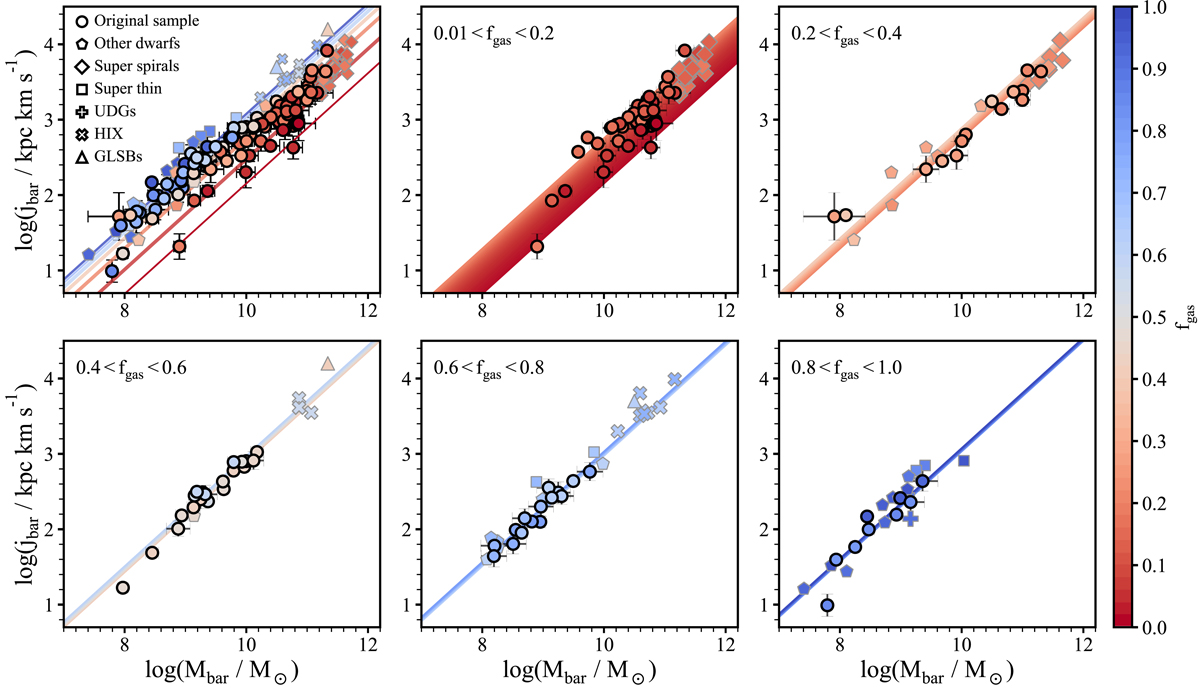
Baryonic jbar − Mbar − fgas plane for our original sample (circles) and a set of extreme galaxies (see text). Top left panel: relation for all the galaxies, while the remaining panels show the galaxies in bins of fgas (given in the top left corner of each panel). First panel, the lines of constant fgas are as in Fig. 1. In the remaining panels, the coloured areas enclose the region delimited by the whole fgas bin. We remark that the coloured lines of our plane are derived by fitting only our data. The rest of the galaxies closely follow our fit.
Current usage metrics show cumulative count of Article Views (full-text article views including HTML views, PDF and ePub downloads, according to the available data) and Abstracts Views on Vision4Press platform.
Data correspond to usage on the plateform after 2015. The current usage metrics is available 48-96 hours after online publication and is updated daily on week days.
Initial download of the metrics may take a while.