Fig. 1.
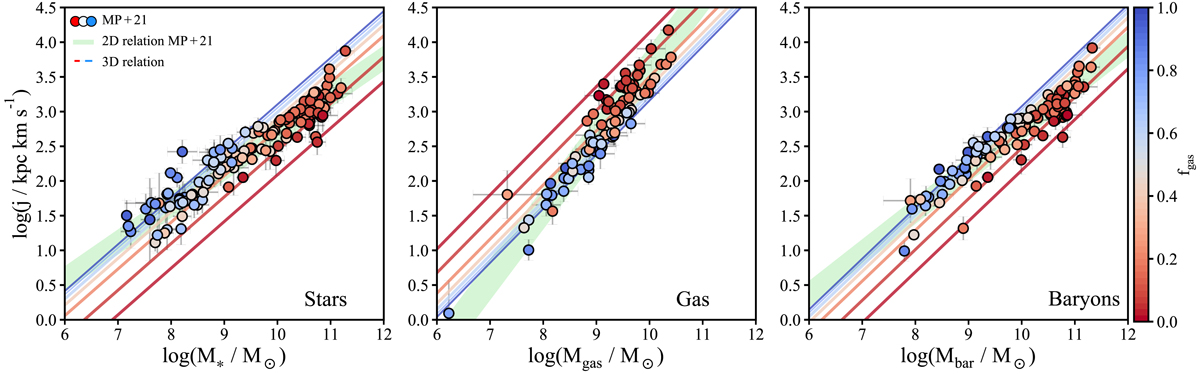
Stellar, gas, and baryonic j − M − fgas planes, projected into the 2D (j, M) spaces. Galaxies are colour-coded according to their fgas and are compared with lines of constant fgas according to Eq. (4) and the best fitting coefficients of Table 1. From red to blue, the lines are at fgas = 0.01, 0.05, 0.2, 0.4, 0.6, 0.8, 1. For comparison, we show in green the best fitting 2D j − M relations from MP21 and their intrinsic scatter.
Current usage metrics show cumulative count of Article Views (full-text article views including HTML views, PDF and ePub downloads, according to the available data) and Abstracts Views on Vision4Press platform.
Data correspond to usage on the plateform after 2015. The current usage metrics is available 48-96 hours after online publication and is updated daily on week days.
Initial download of the metrics may take a while.