Open Access
Fig. A.1.
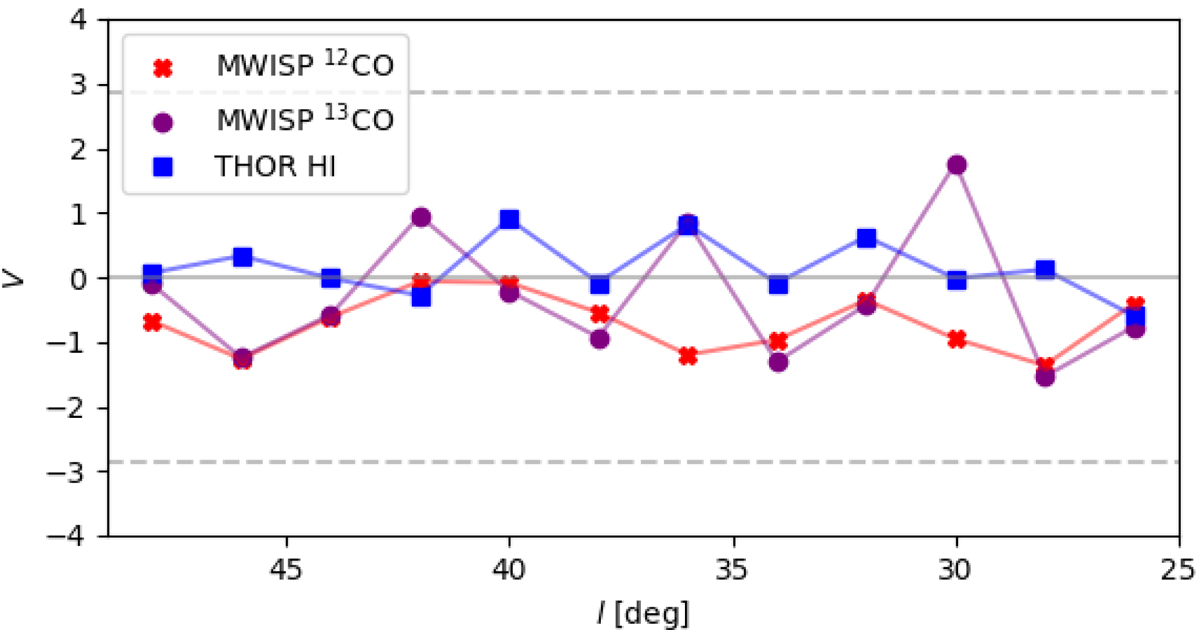
Projected Rayleigh statistic (V) obtained for 2° × 2° tiles in the integrated (moment-zero) emission maps from the THOR HI and MWISP 12CO and 13CO observations. The horizontal dashed lines correspond to V = ±2.87, which is roughly equivalent to a 3σ confidence interval in that statistic of an angle distribution.
Current usage metrics show cumulative count of Article Views (full-text article views including HTML views, PDF and ePub downloads, according to the available data) and Abstracts Views on Vision4Press platform.
Data correspond to usage on the plateform after 2015. The current usage metrics is available 48-96 hours after online publication and is updated daily on week days.
Initial download of the metrics may take a while.