Open Access
Fig. 3.
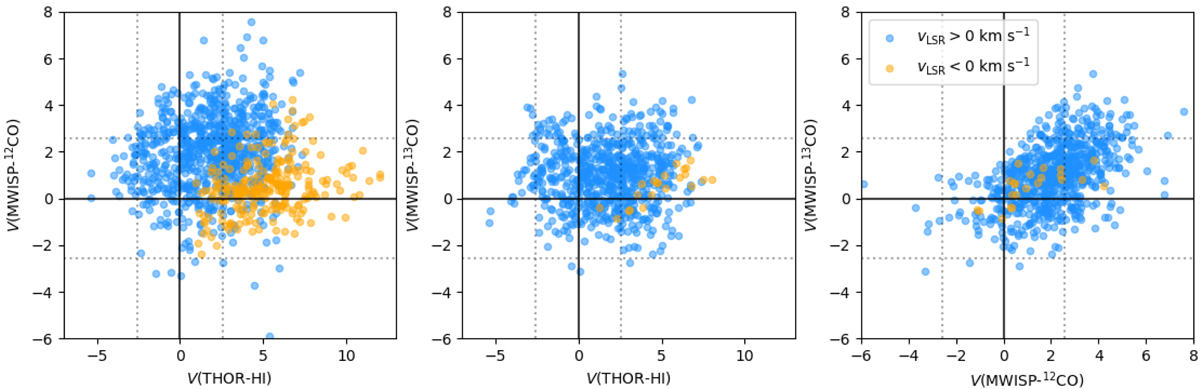
Comparison between the values of the projected Rayleigh statistic (V) in the THOR HI and the MWISP CO observations. The two colors correspond to the positive and negative radial velocities. The dotted lines mark the 3σ significance thresholds in V.
Current usage metrics show cumulative count of Article Views (full-text article views including HTML views, PDF and ePub downloads, according to the available data) and Abstracts Views on Vision4Press platform.
Data correspond to usage on the plateform after 2015. The current usage metrics is available 48-96 hours after online publication and is updated daily on week days.
Initial download of the metrics may take a while.