Fig. 2.
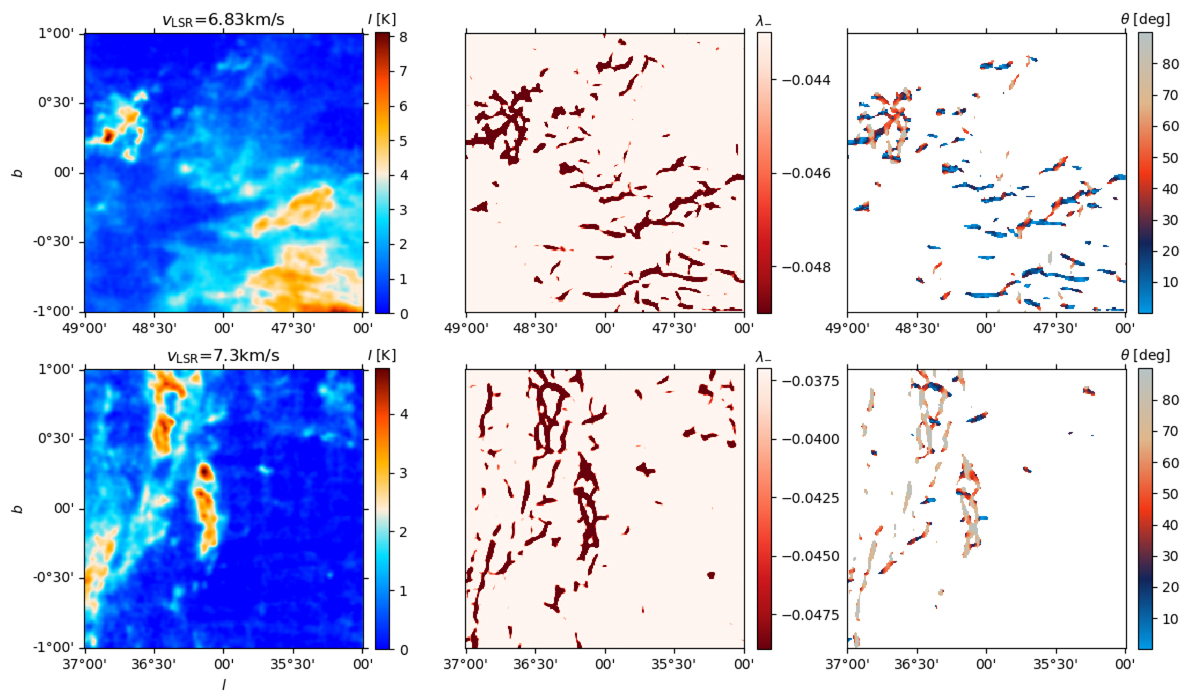
Results of the Hessian analysis in the 2° × 2° tiles of the MWISP 12CO observations with the maximum (top) and minimum (bottom) values of V, which can be interpreted as a tile dominated by horizontal structures and a tile dominated by vertical structures, respectively. Left: intensity map. Center: map of the eigenvalue of the Hessian matrix identified as λ− in Eq. (2), which is used to characterize the filamentary structures in the intensity map. Right: map of the orientation angles evaluated using Eq. (3) after the selections by I and λ− introduced in Sect. 2.2.
Current usage metrics show cumulative count of Article Views (full-text article views including HTML views, PDF and ePub downloads, according to the available data) and Abstracts Views on Vision4Press platform.
Data correspond to usage on the plateform after 2015. The current usage metrics is available 48-96 hours after online publication and is updated daily on week days.
Initial download of the metrics may take a while.