Fig. 1.
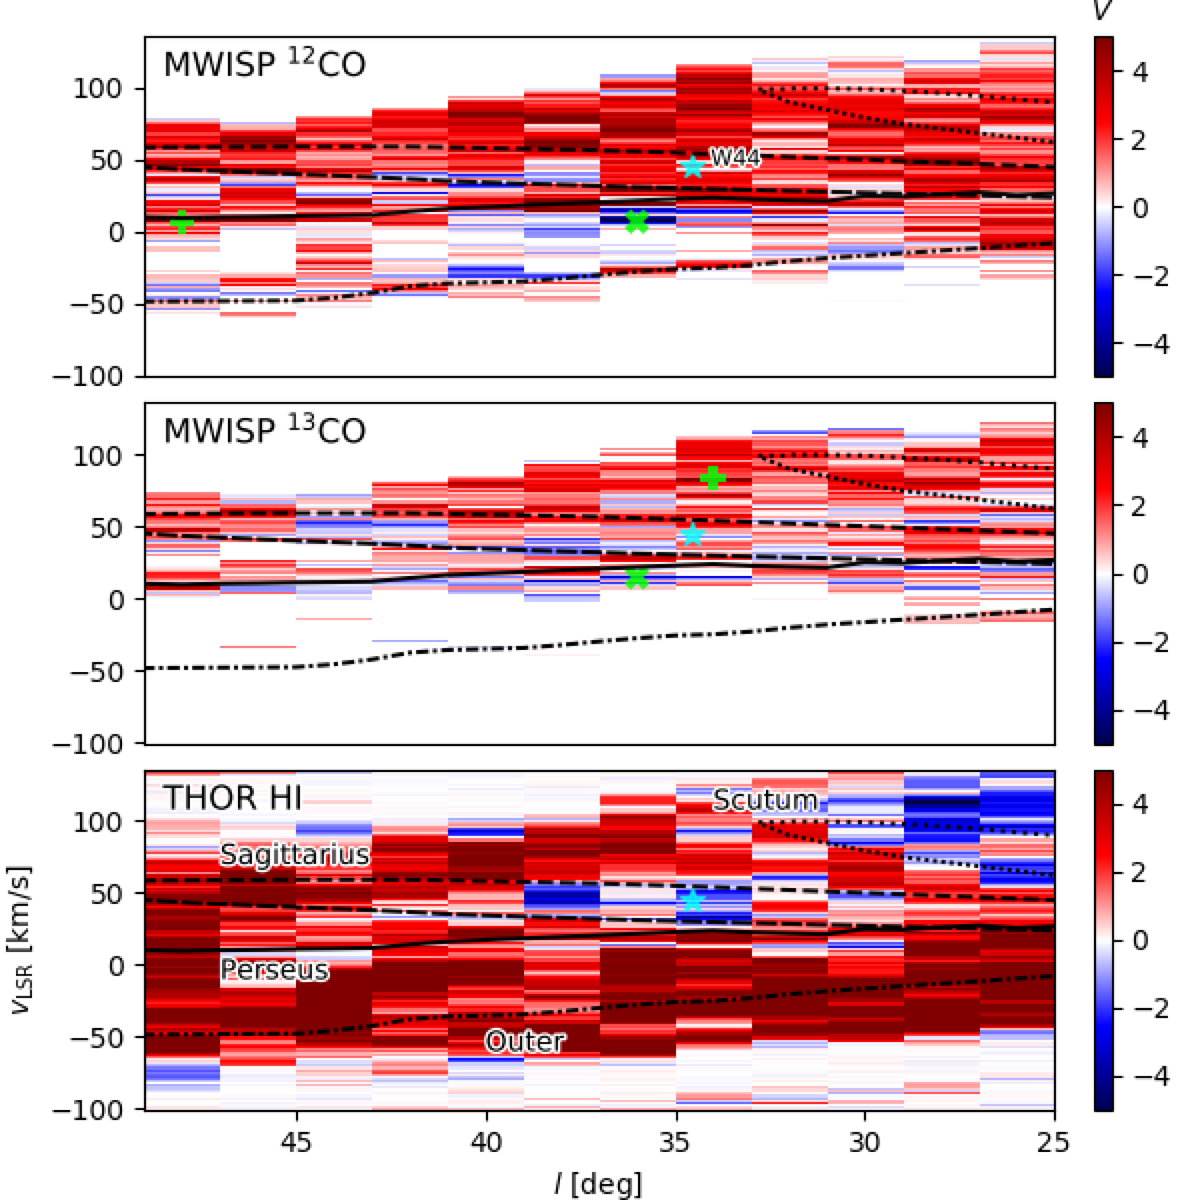
Projected Rayleigh statistic (V) corresponding to the orientation of the filamentary structures identified in the 2° × 2° tiles and across velocity channels in the THOR HI and MWISP 12CO and 13CO observations. The overlaid curves correspond to selected spiral arms from the model presented in Reid et al. (2016). The plus sign (+) and the cross (×) mark the tiles with the highest and the lowest V, respectively, whose maps are shown for reference in Fig. 2. The star symbols mark the positions of the SN remnant W44.
Current usage metrics show cumulative count of Article Views (full-text article views including HTML views, PDF and ePub downloads, according to the available data) and Abstracts Views on Vision4Press platform.
Data correspond to usage on the plateform after 2015. The current usage metrics is available 48-96 hours after online publication and is updated daily on week days.
Initial download of the metrics may take a while.