Free Access
Fig. 6.
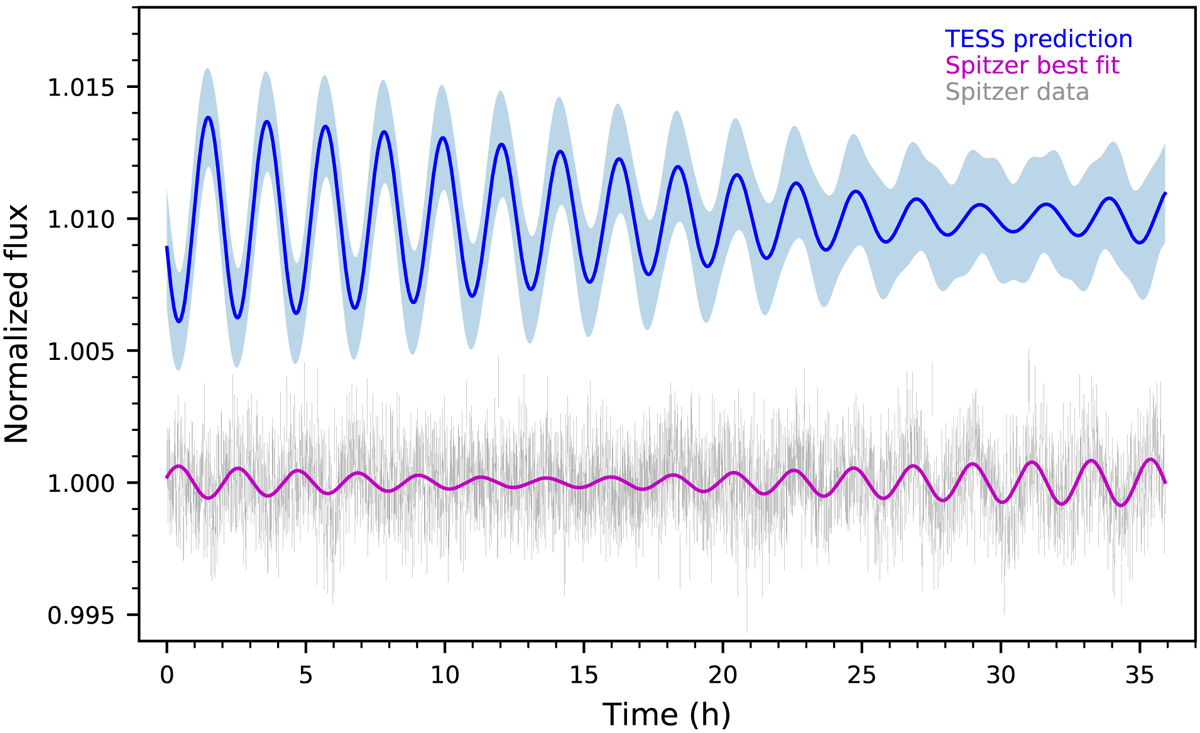
Spitzer pixel-phase-corrected light curve of VHS J1256-1257AB (gray symbols) and the best fit for model E (magenta). A projection of the TESS variability at the moment of the Spitzer observations (7.7 months later than the beginning of TESS sector 10) is shown in blue.
Current usage metrics show cumulative count of Article Views (full-text article views including HTML views, PDF and ePub downloads, according to the available data) and Abstracts Views on Vision4Press platform.
Data correspond to usage on the plateform after 2015. The current usage metrics is available 48-96 hours after online publication and is updated daily on week days.
Initial download of the metrics may take a while.