Free Access
Fig. A.4.
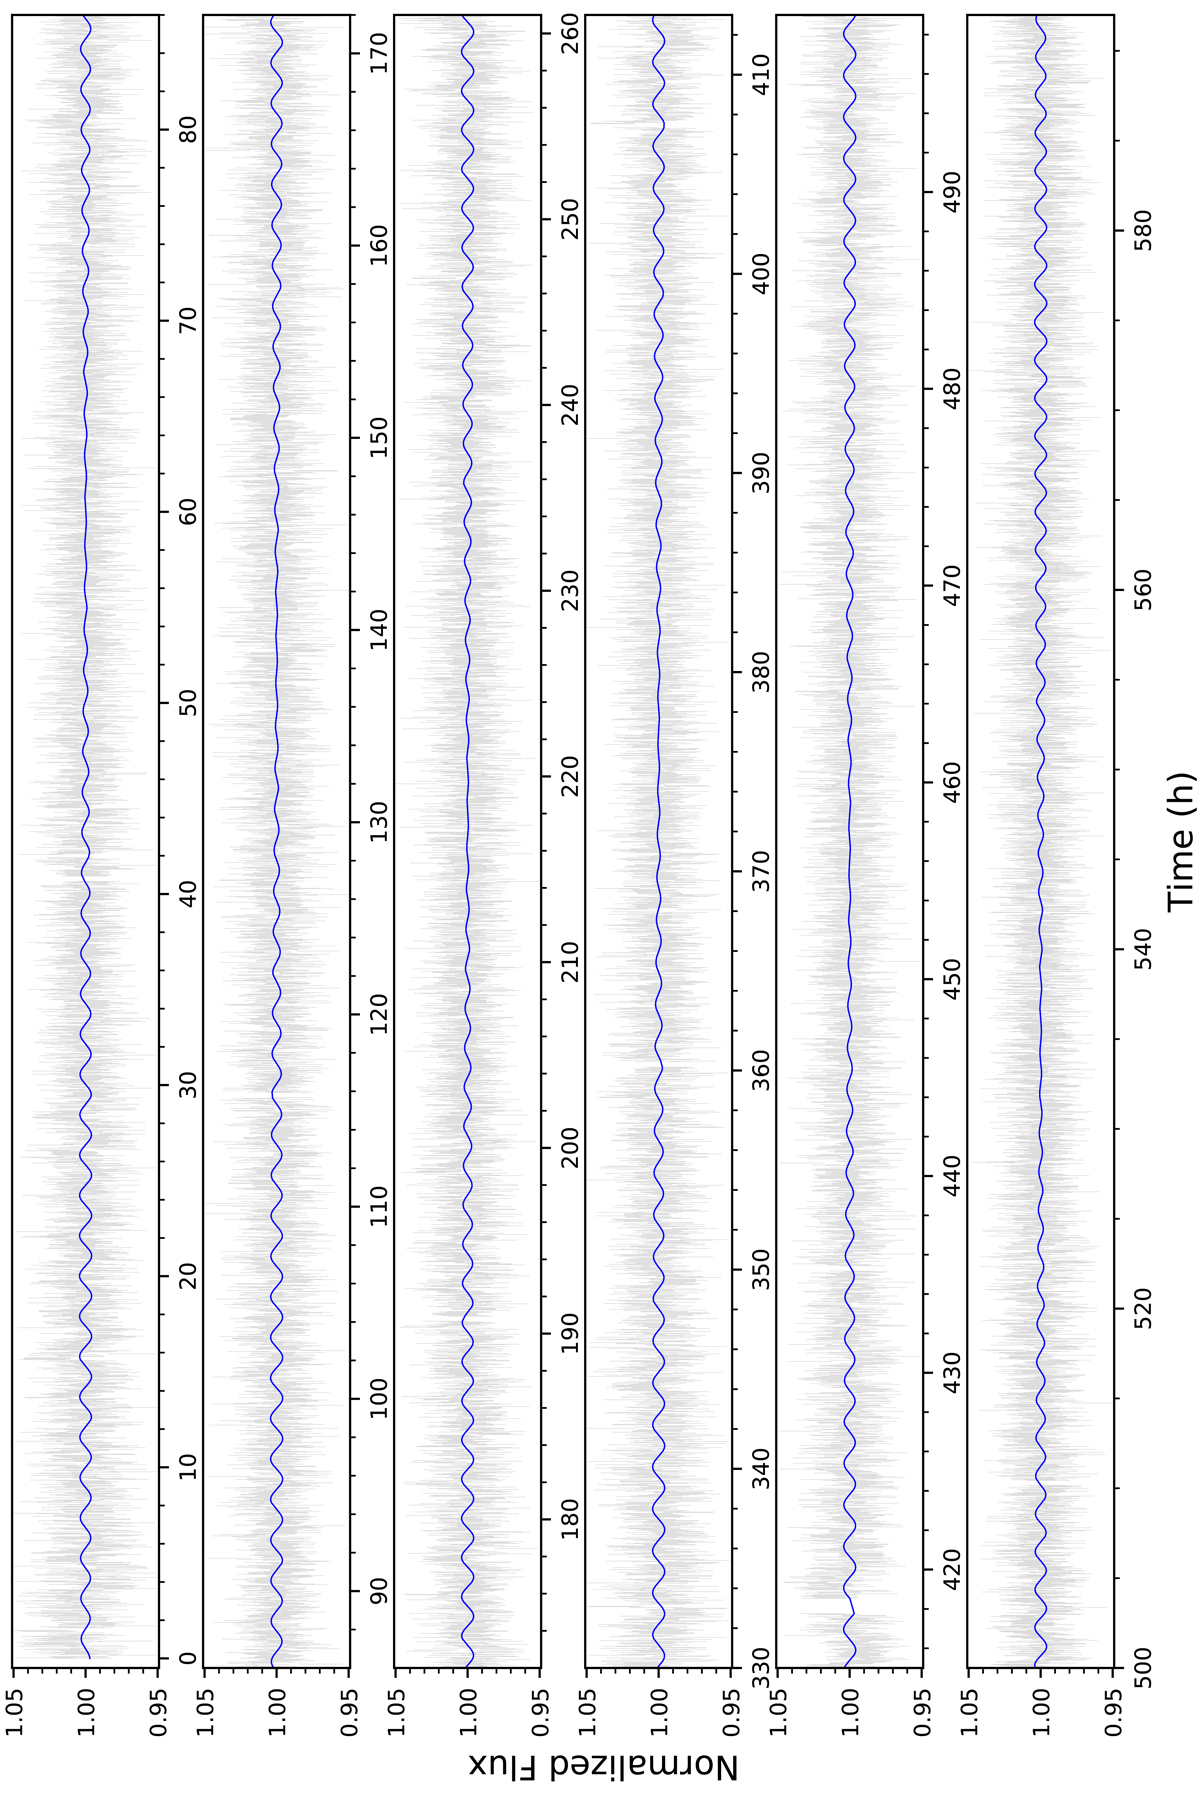
TESS light curve of VHS J1256-1257AB after removing the best fit for correlated noise from model E. The best fit for the interference of two waves is plotted in blue. Model E can explain the epochs of modulation and stochastic variability in the data.
Current usage metrics show cumulative count of Article Views (full-text article views including HTML views, PDF and ePub downloads, according to the available data) and Abstracts Views on Vision4Press platform.
Data correspond to usage on the plateform after 2015. The current usage metrics is available 48-96 hours after online publication and is updated daily on week days.
Initial download of the metrics may take a while.