Fig. 3.
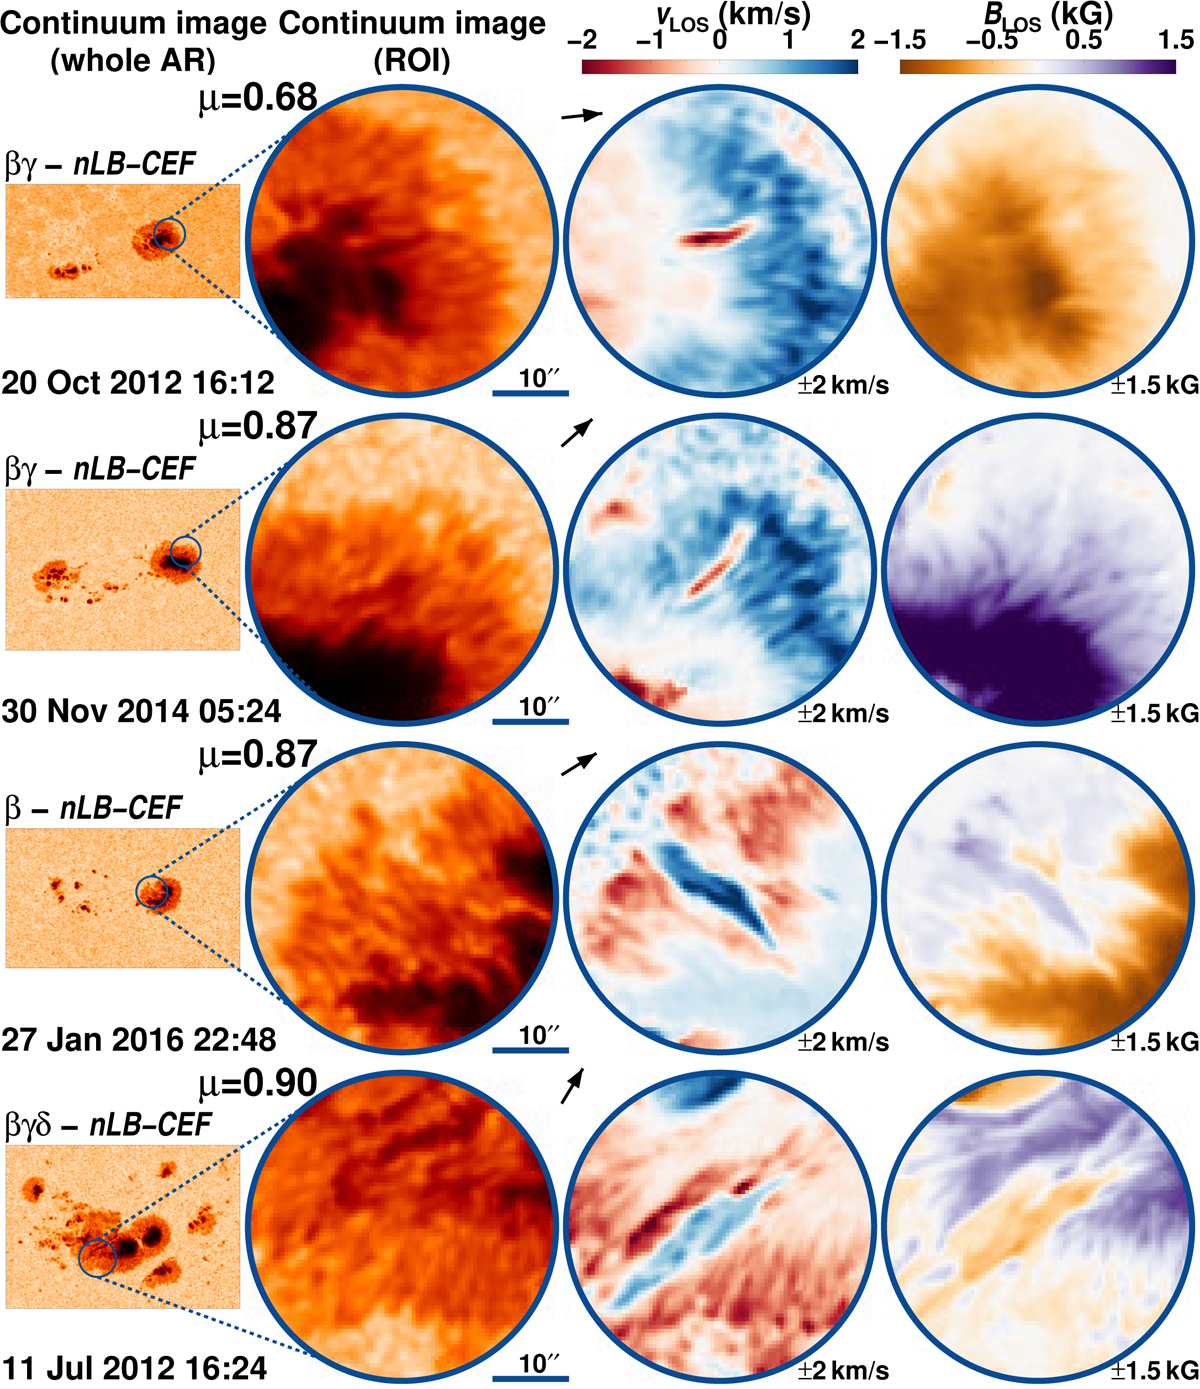
Examples of CEFs not associated with light bridges (nLB-CEFs) found in four ARs. In every row, the left-most map is the continuum image of the whole AR, and the three next maps present a close-up of the region surrounding the CEF. From left to right they are: the continuum image, the Dopplergram clipped at ±2 km s−1, and the magnetogram clipped at ±1.5 kG. Arrows point toward disk center. The magnetic classification of the AR and the time of the observation are shown at the top-left and bottom-left of each row.
Current usage metrics show cumulative count of Article Views (full-text article views including HTML views, PDF and ePub downloads, according to the available data) and Abstracts Views on Vision4Press platform.
Data correspond to usage on the plateform after 2015. The current usage metrics is available 48-96 hours after online publication and is updated daily on week days.
Initial download of the metrics may take a while.